ESMT · Data for Good · Frankfurt Zoological Society
What should FZS track every year?
Five indicators to see illegal gold mining earlier and know where it happens, starting with Peru.
Group 5 · Giant River Turtle · October 2026 Likitha Yenuga · Laura Pérez · Pietro Maran · Erion Vathi · Santiago Sierra
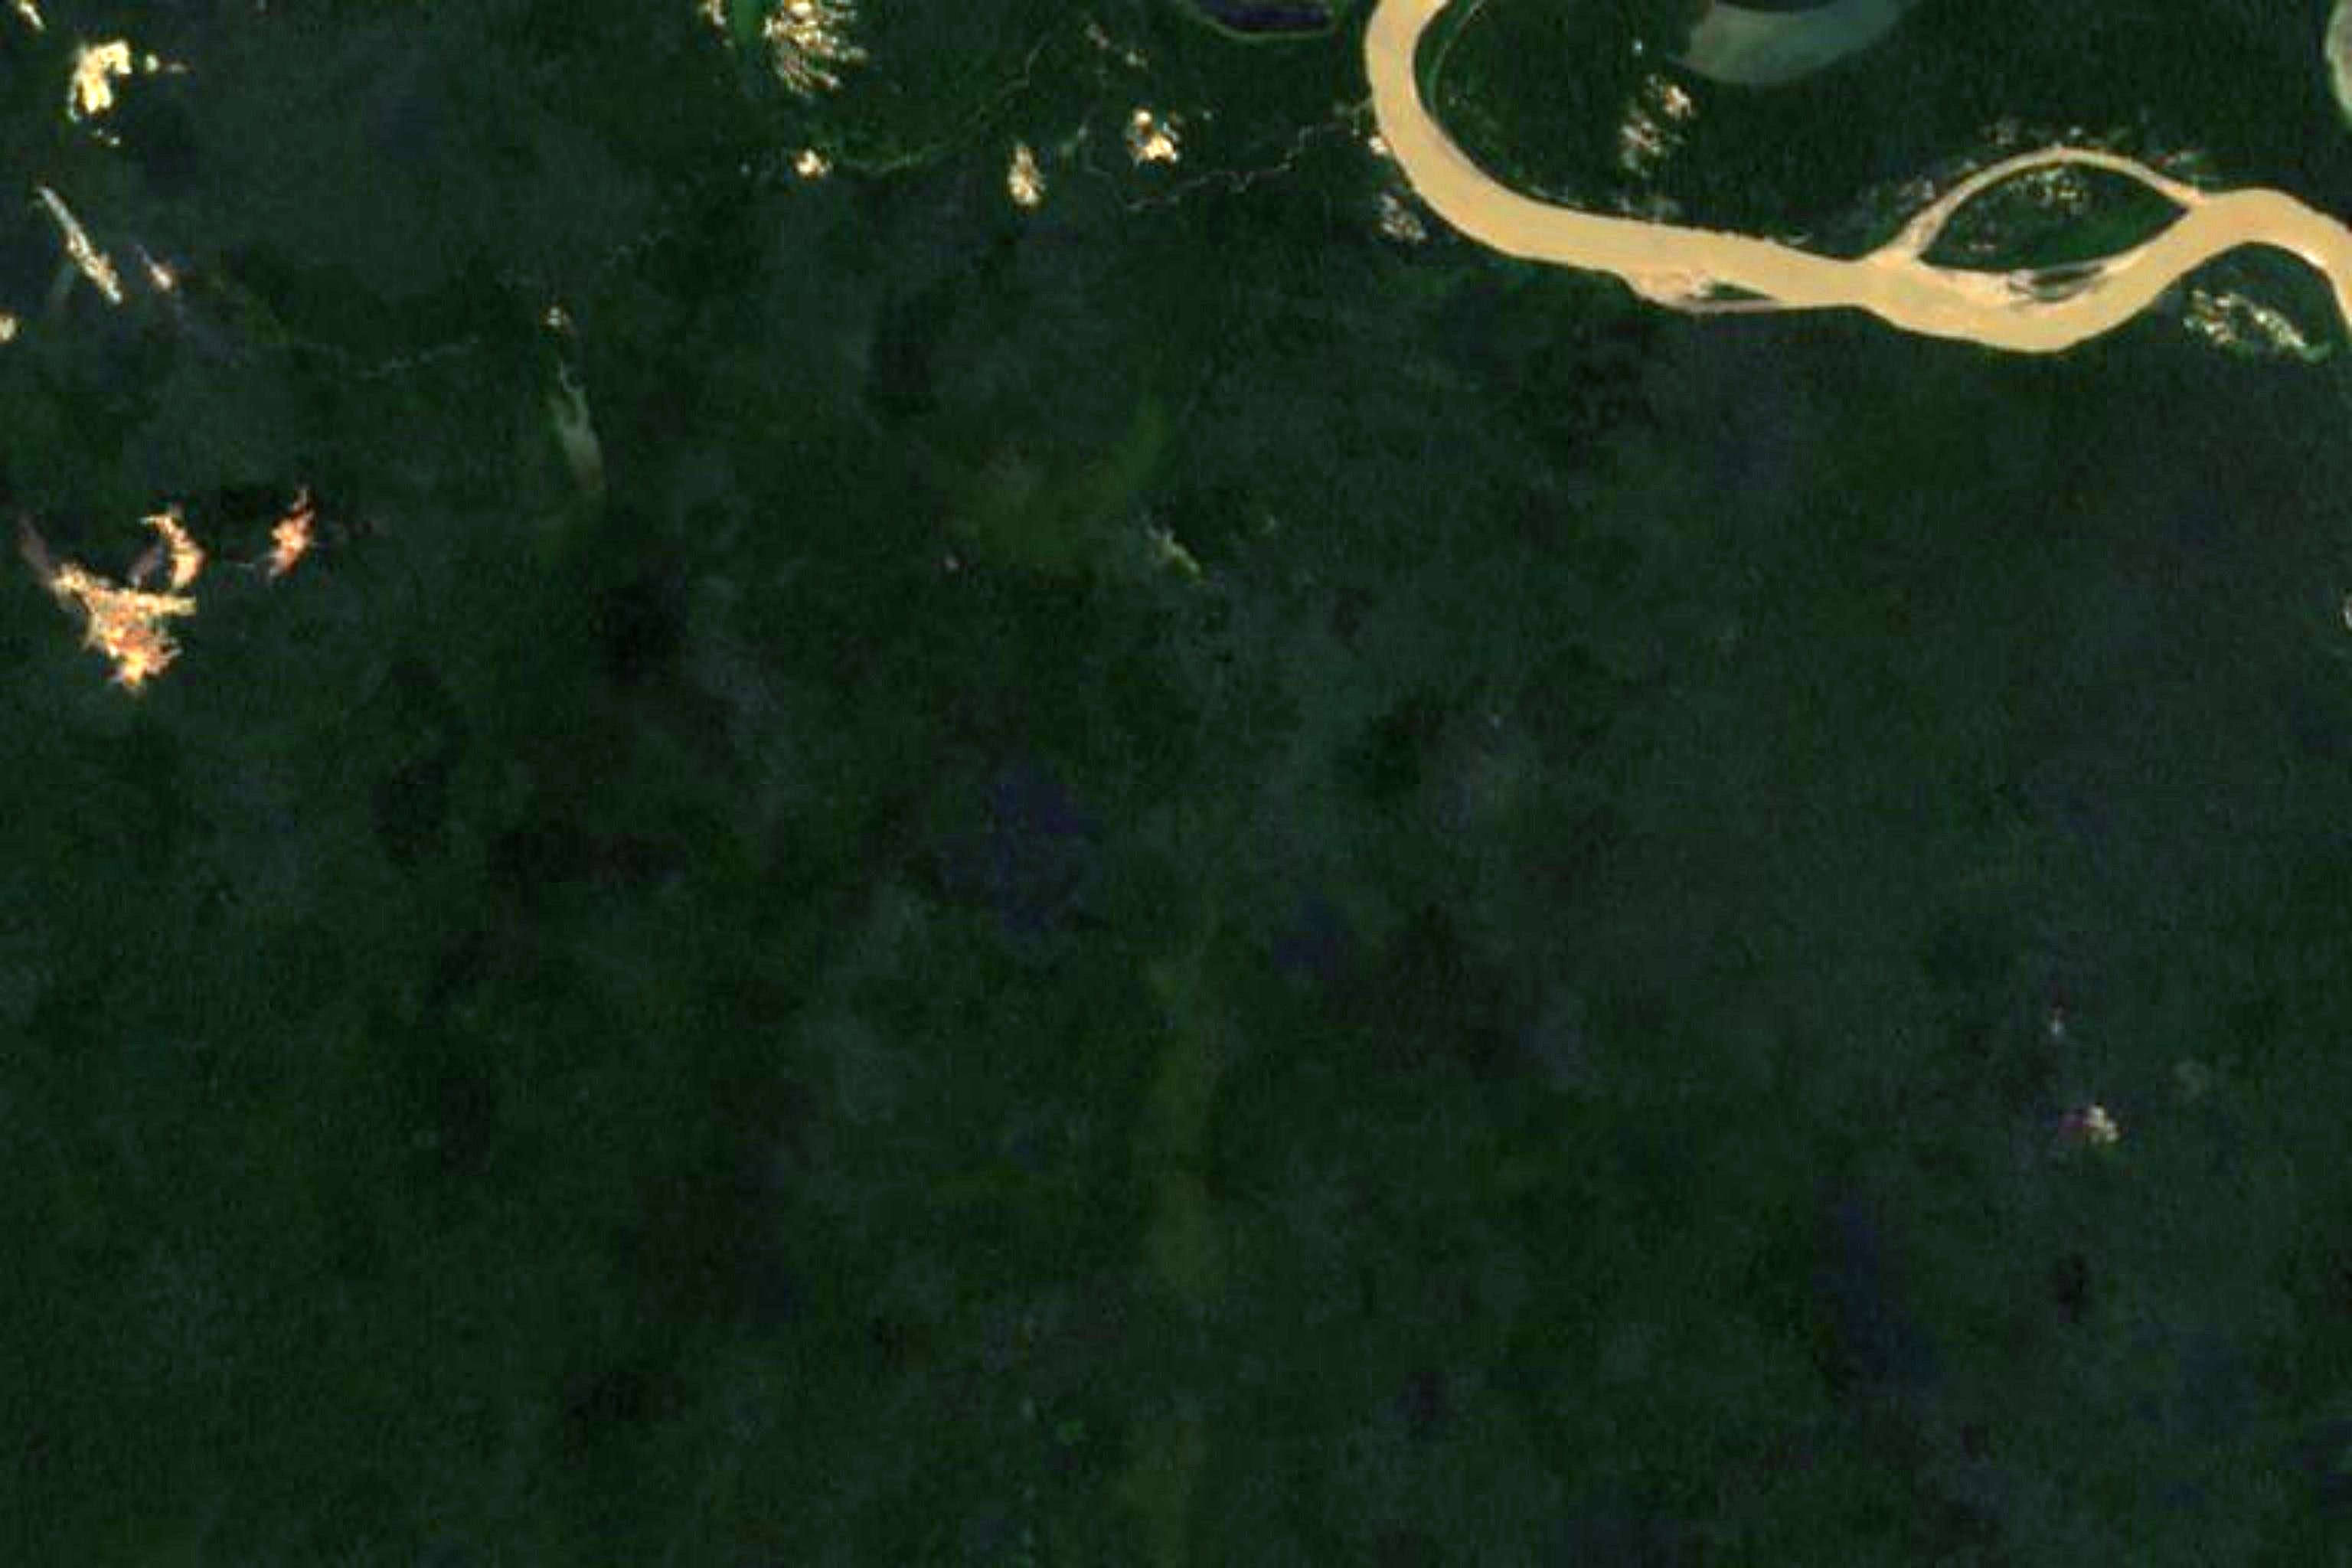
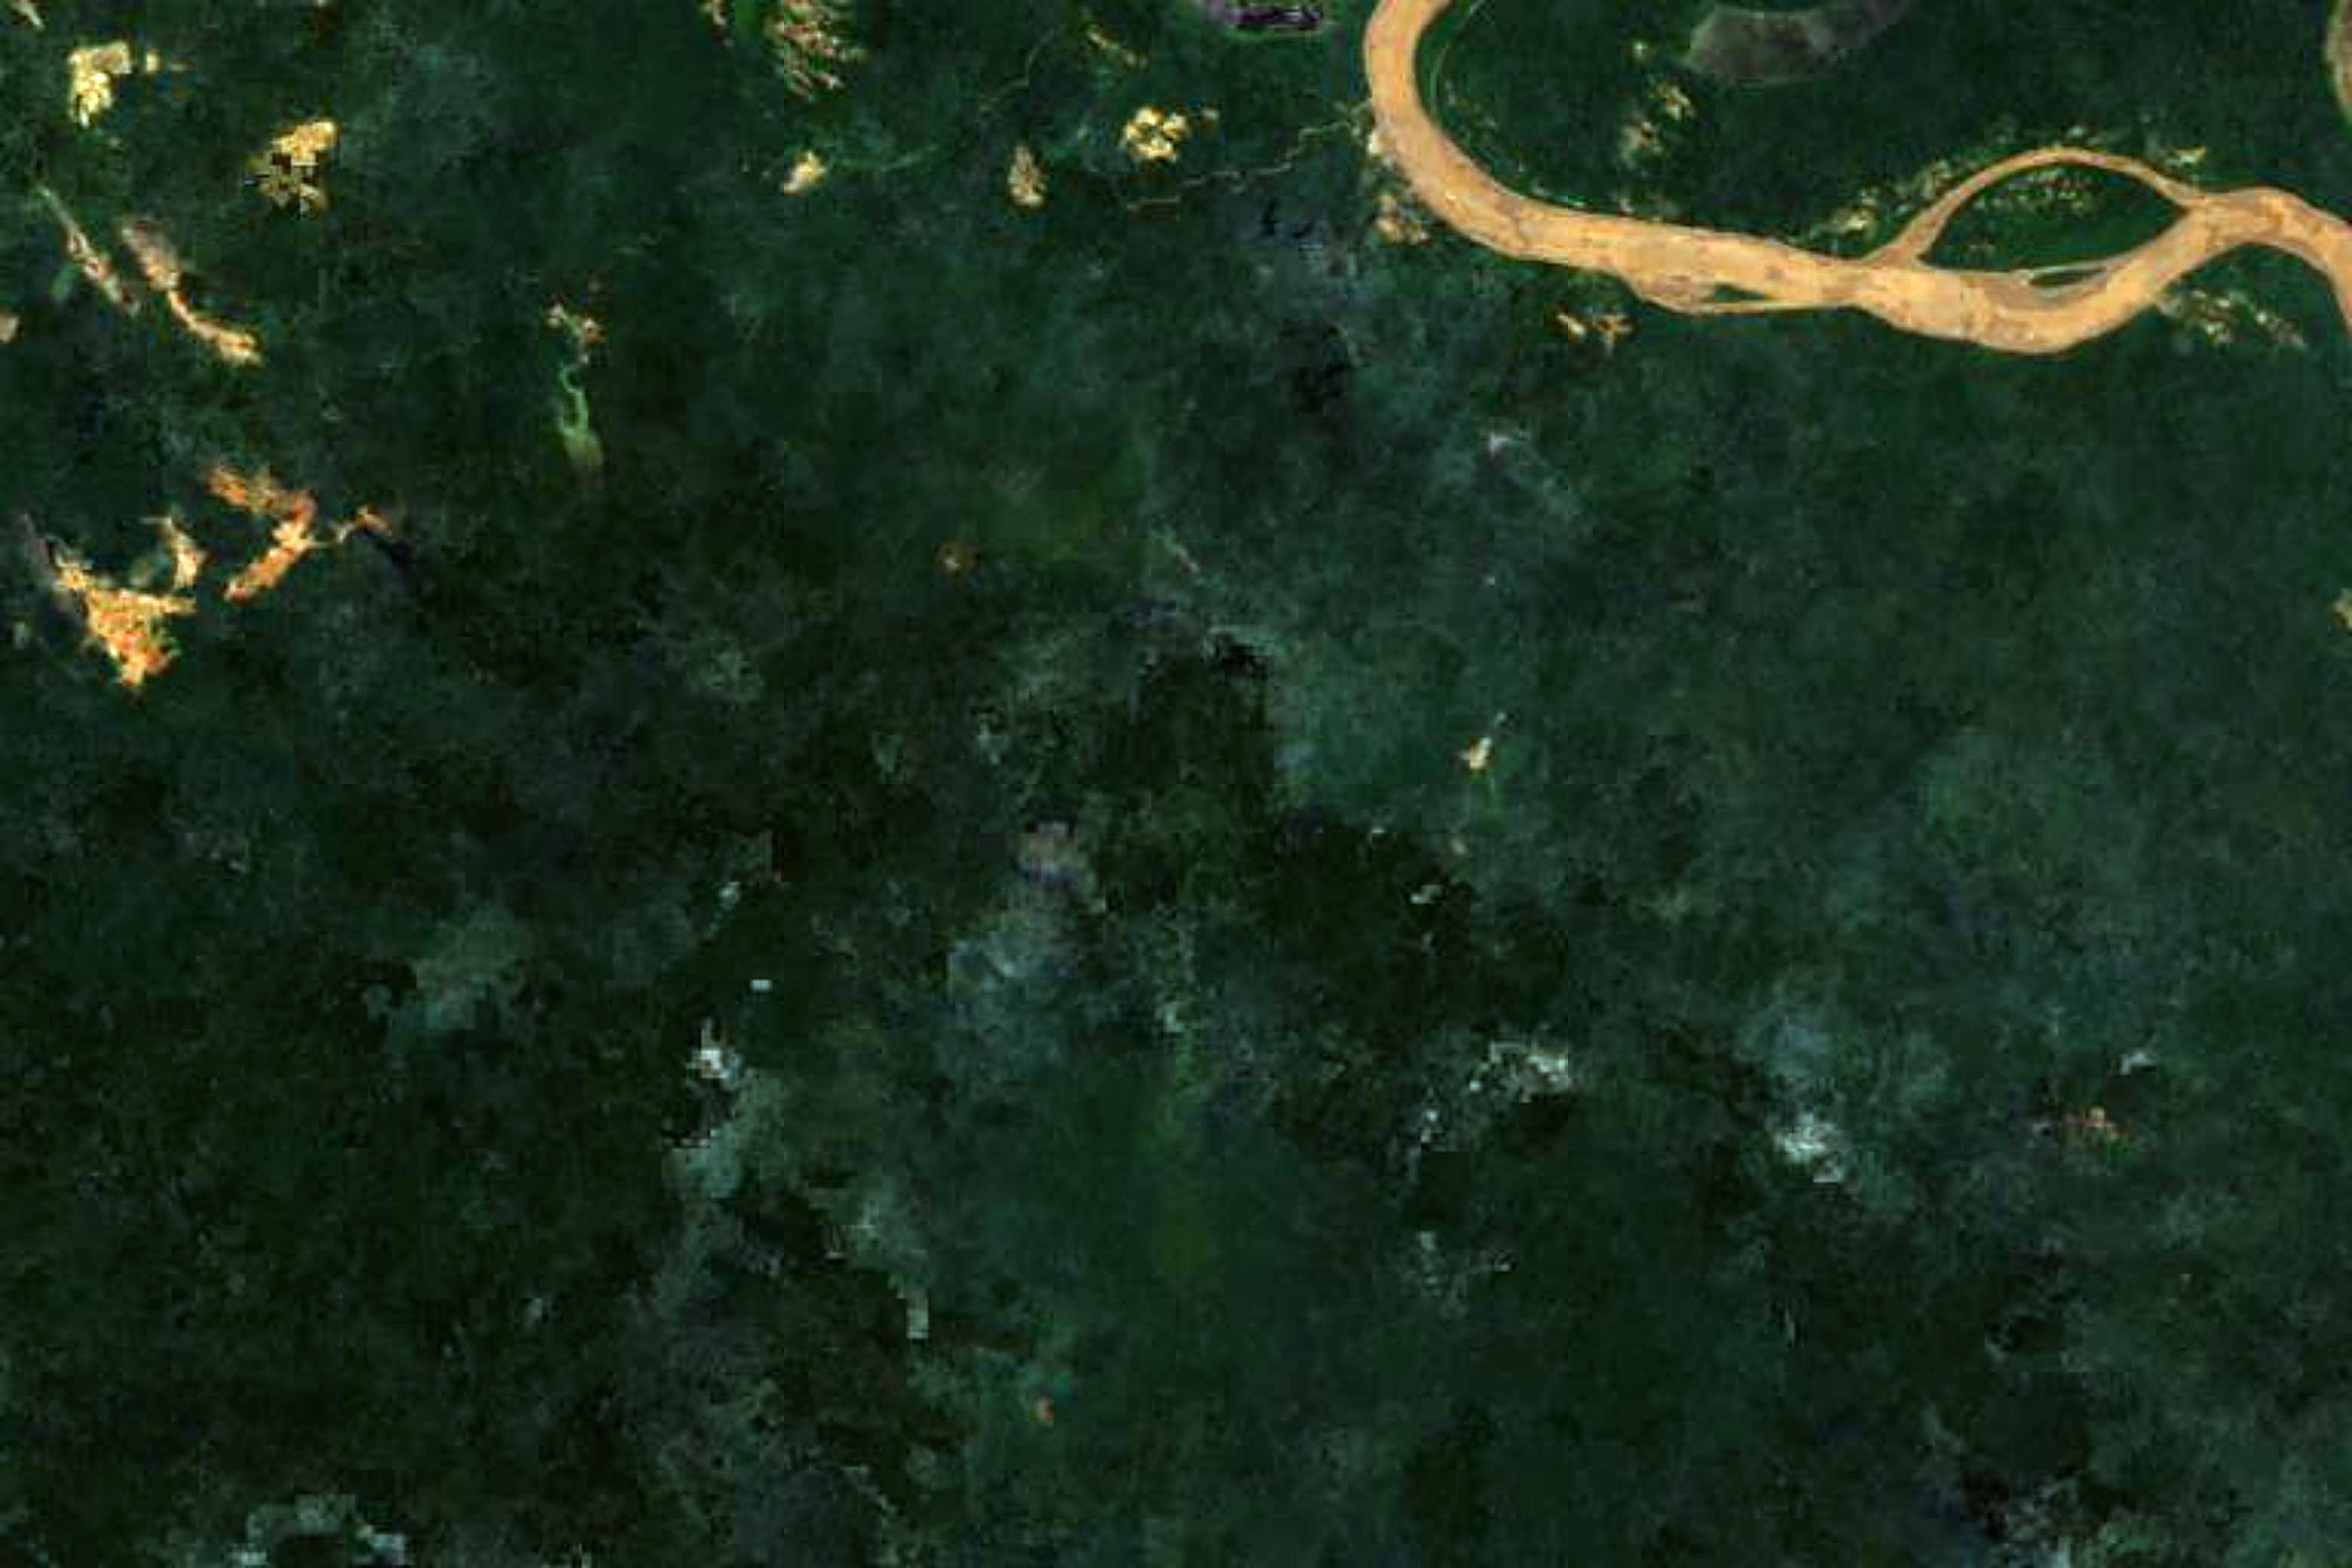
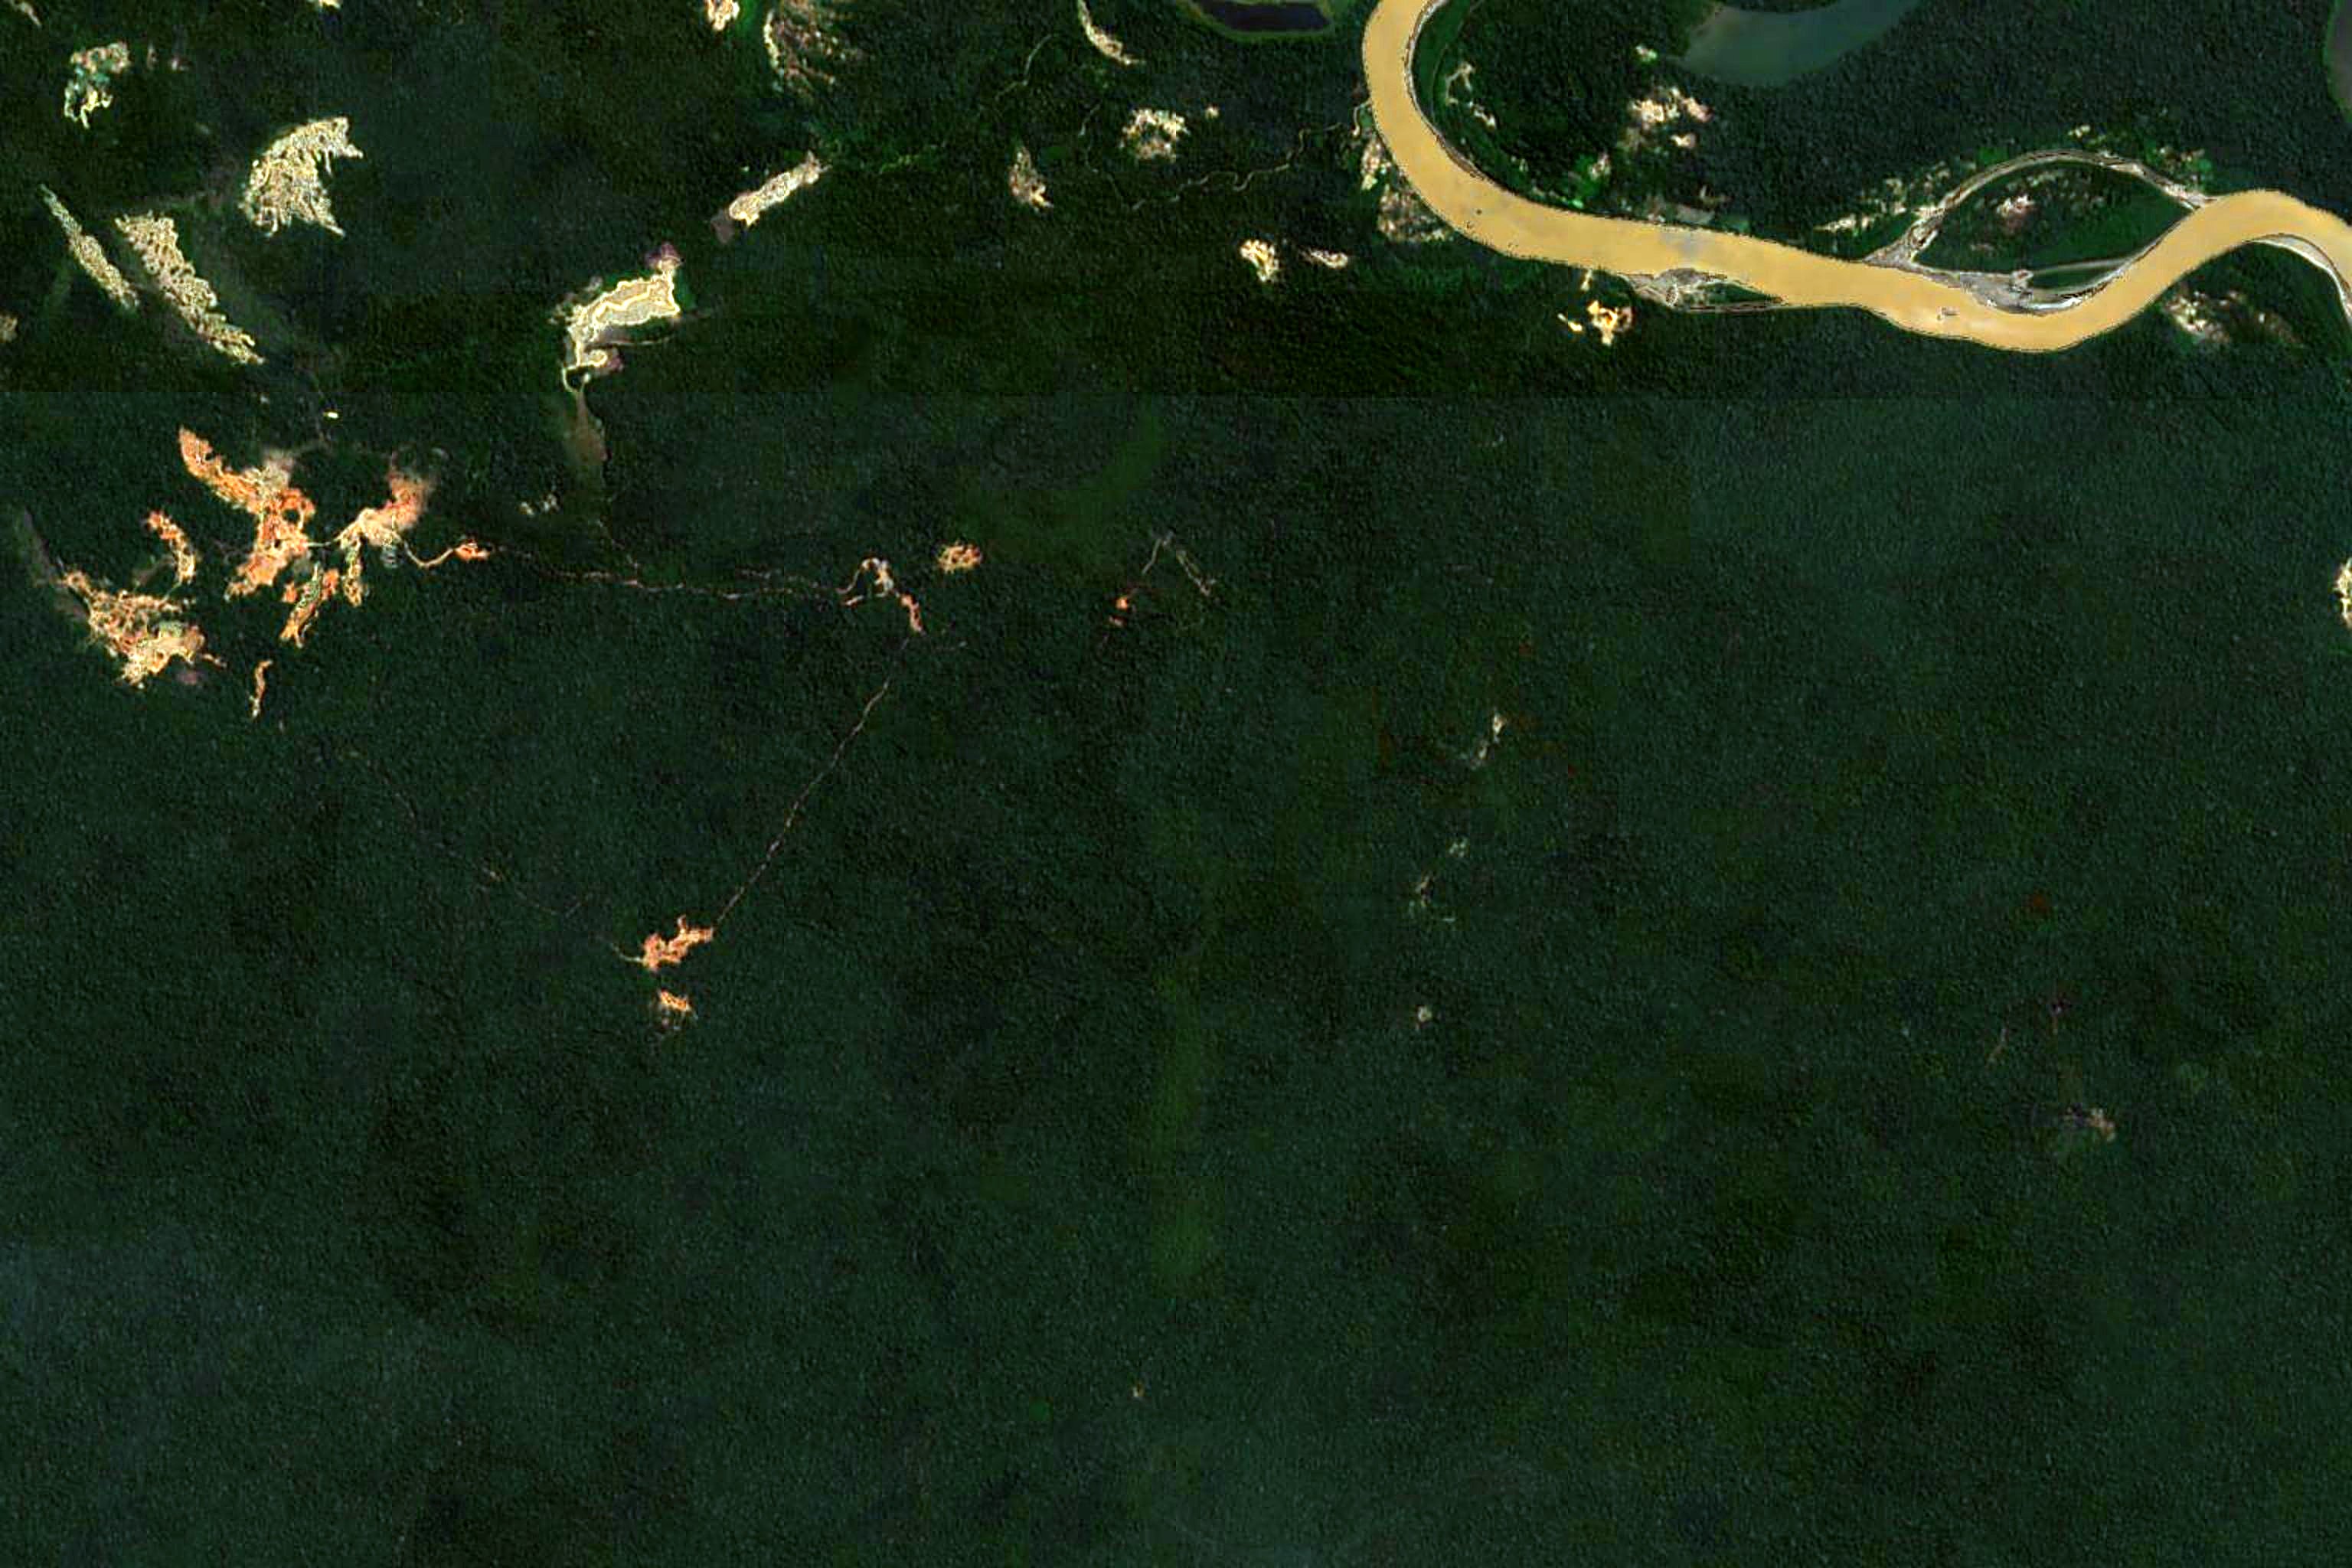
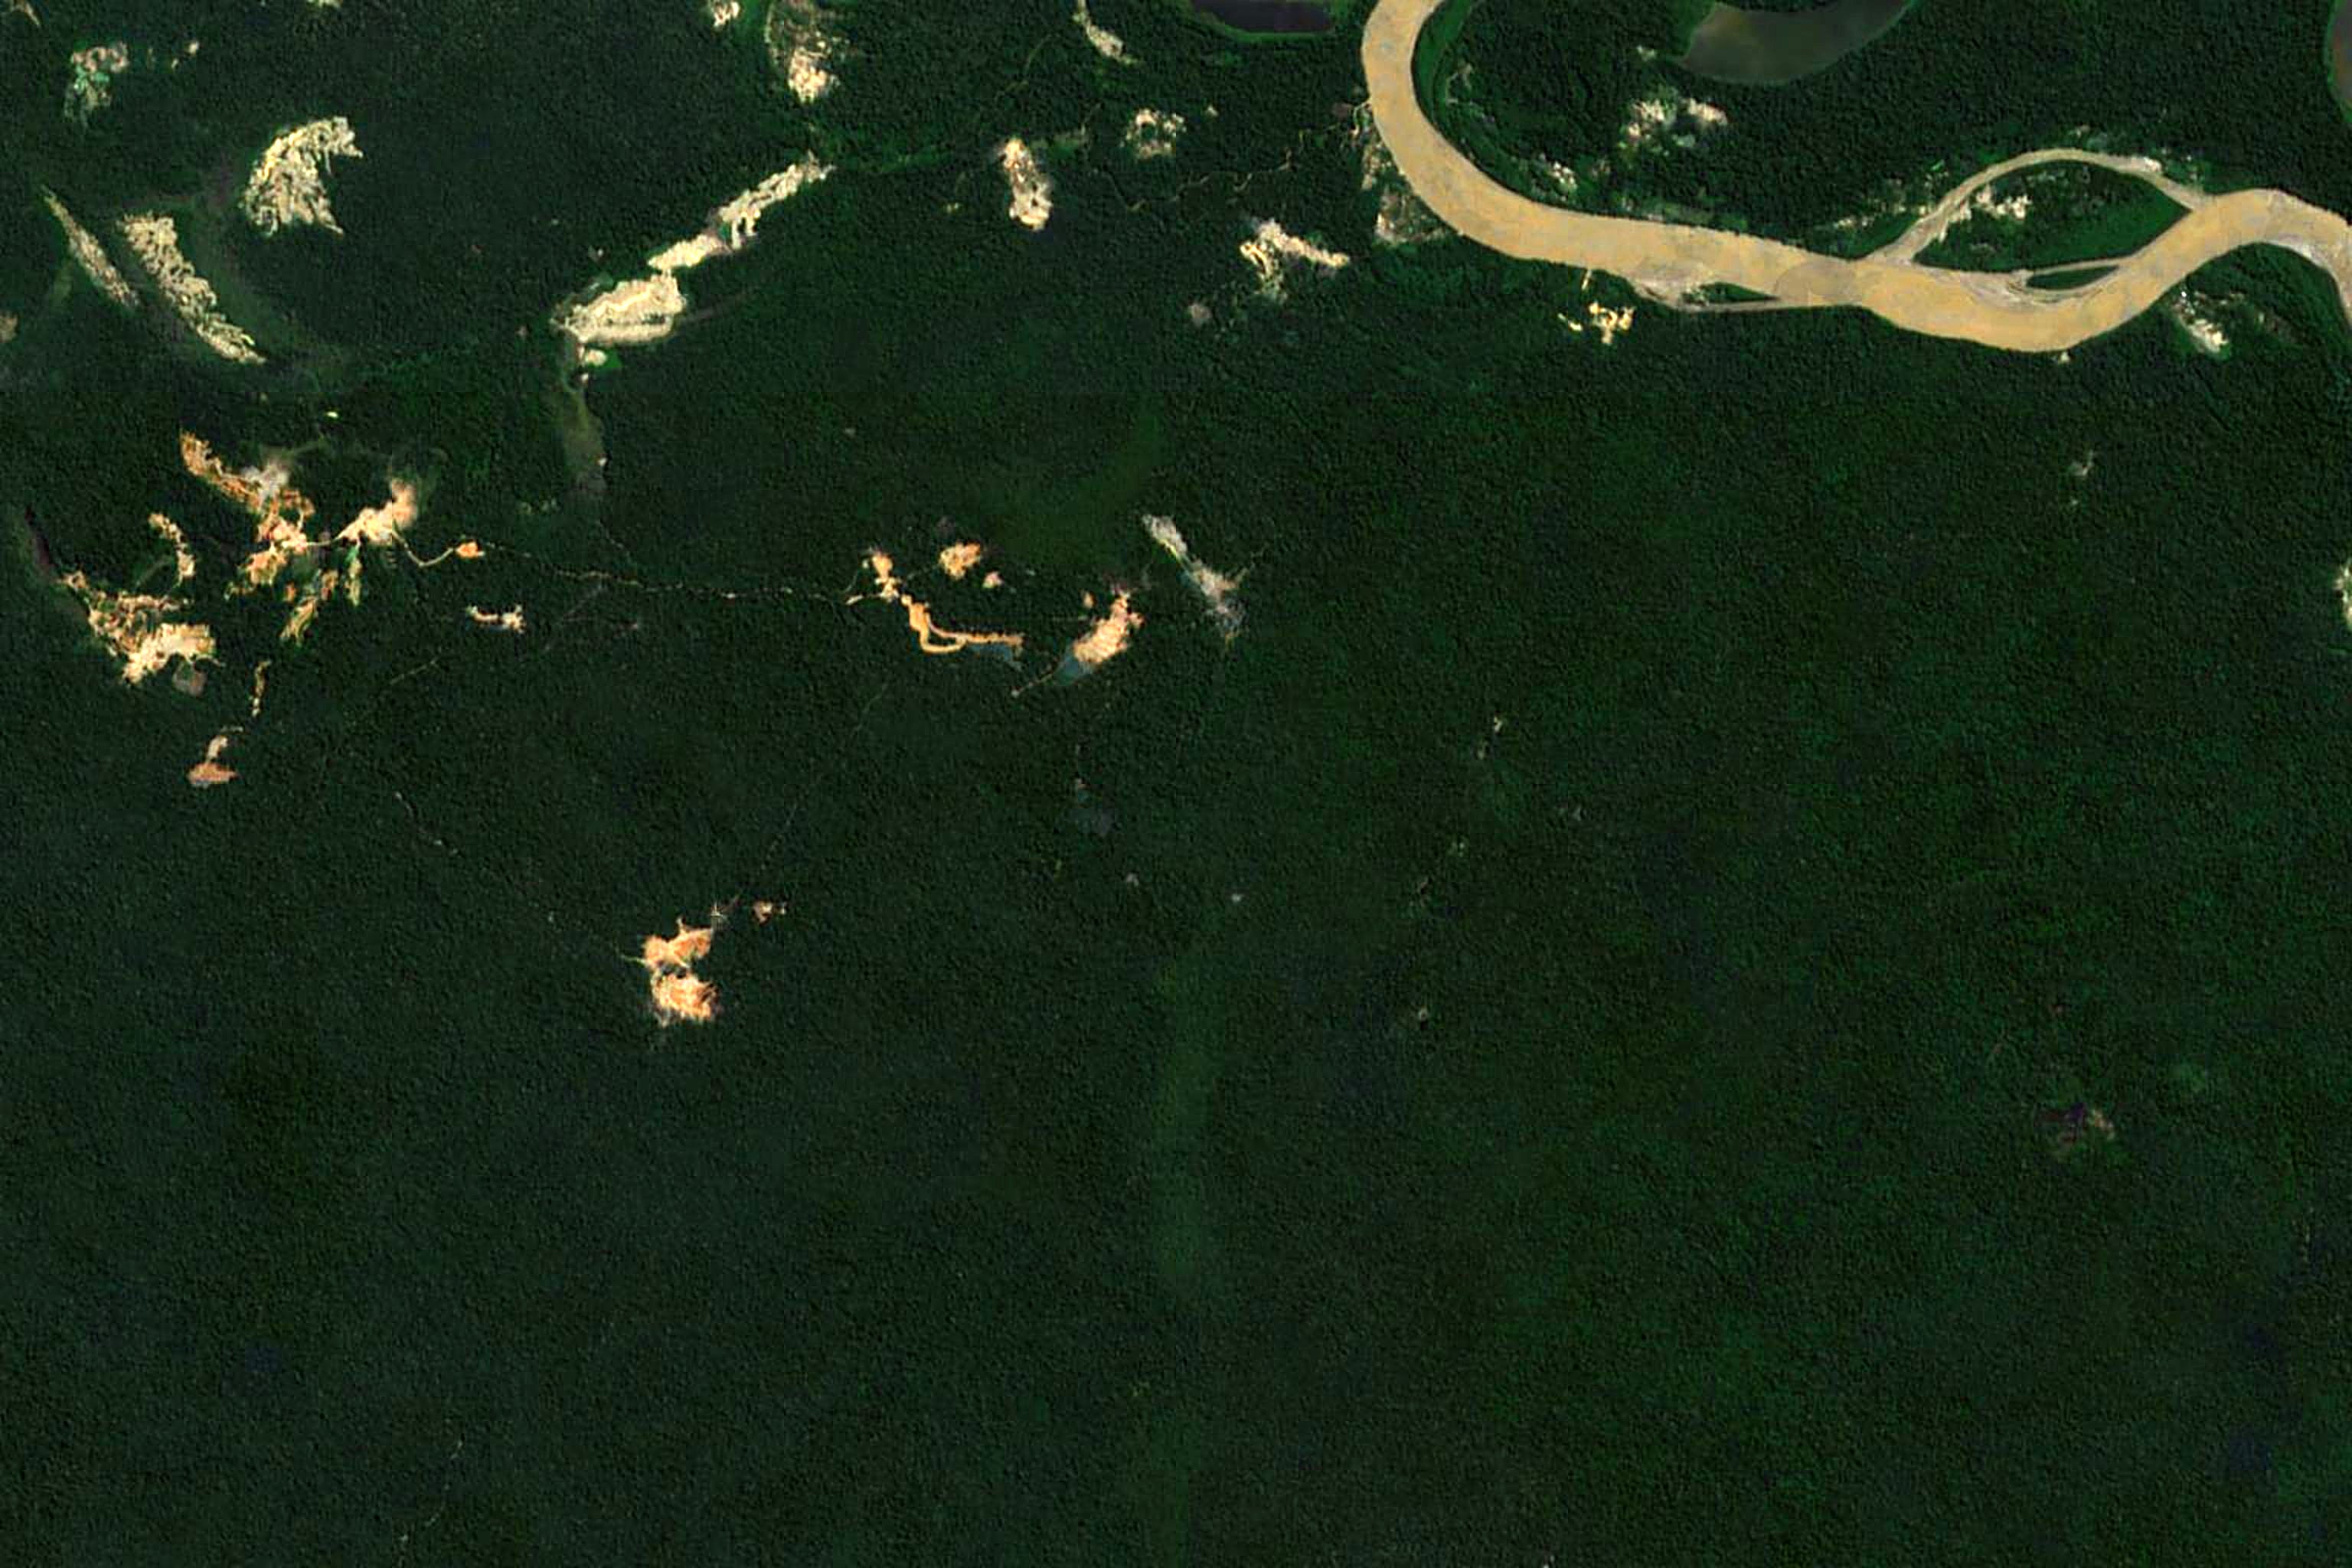
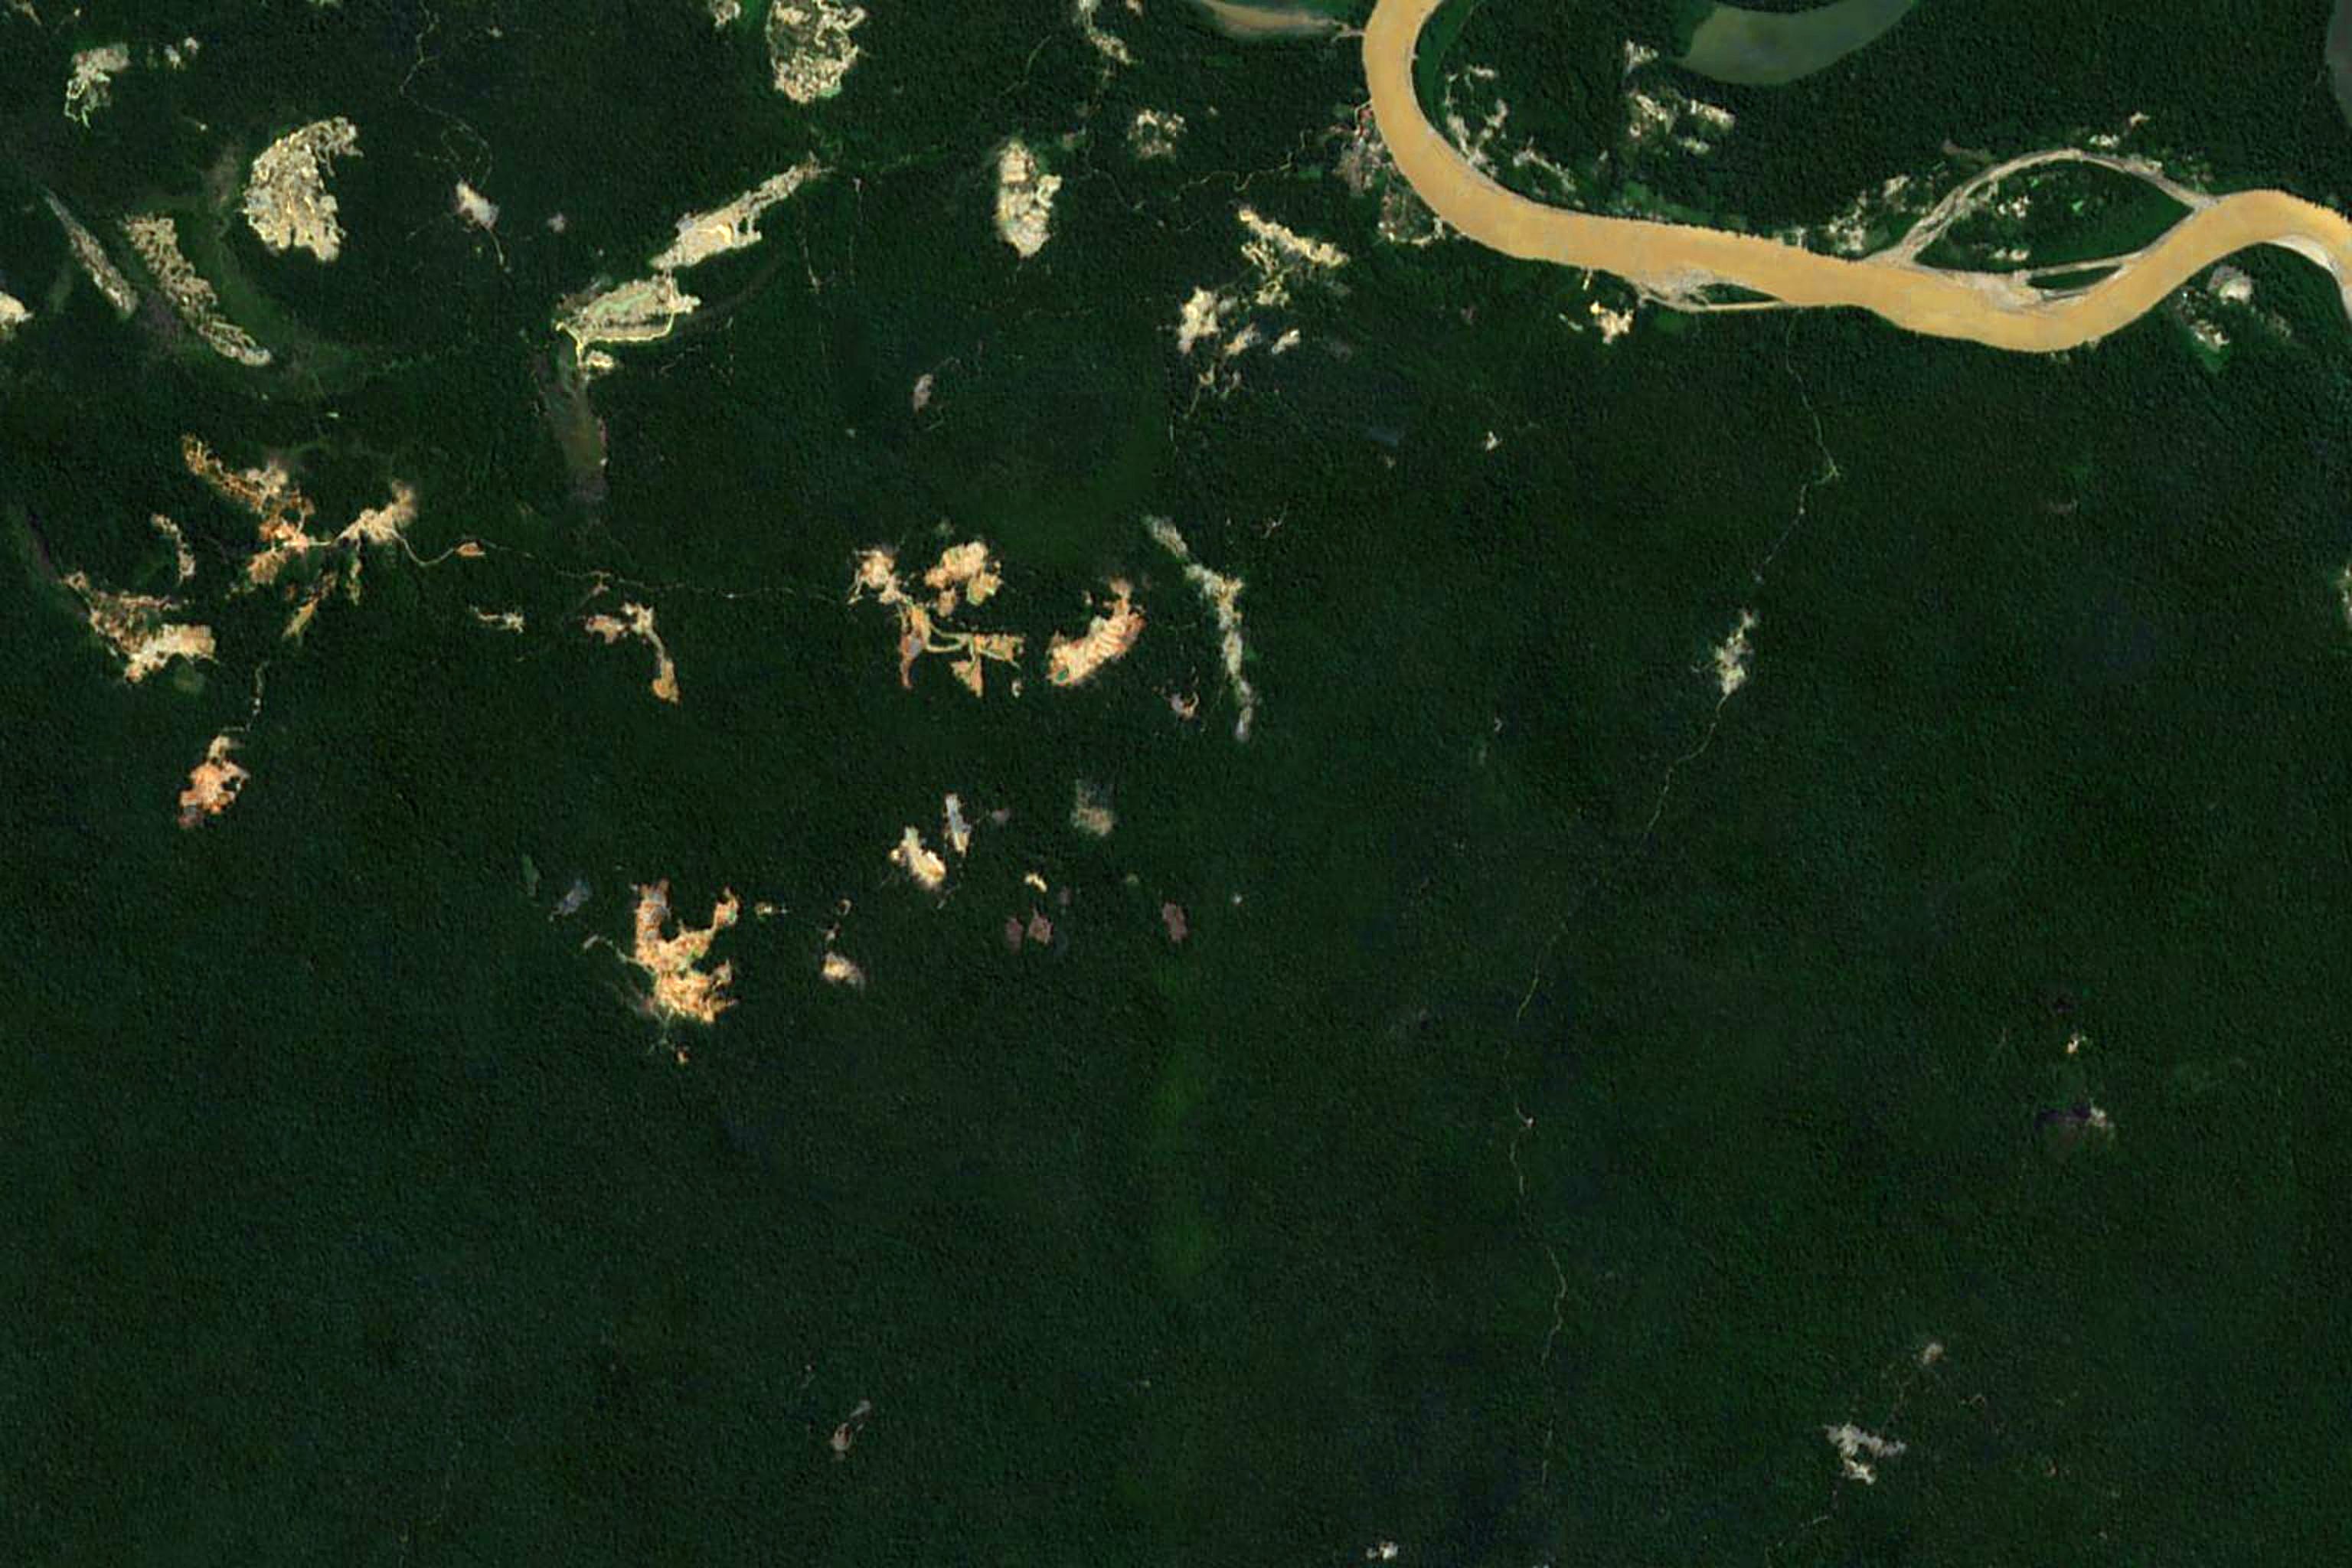
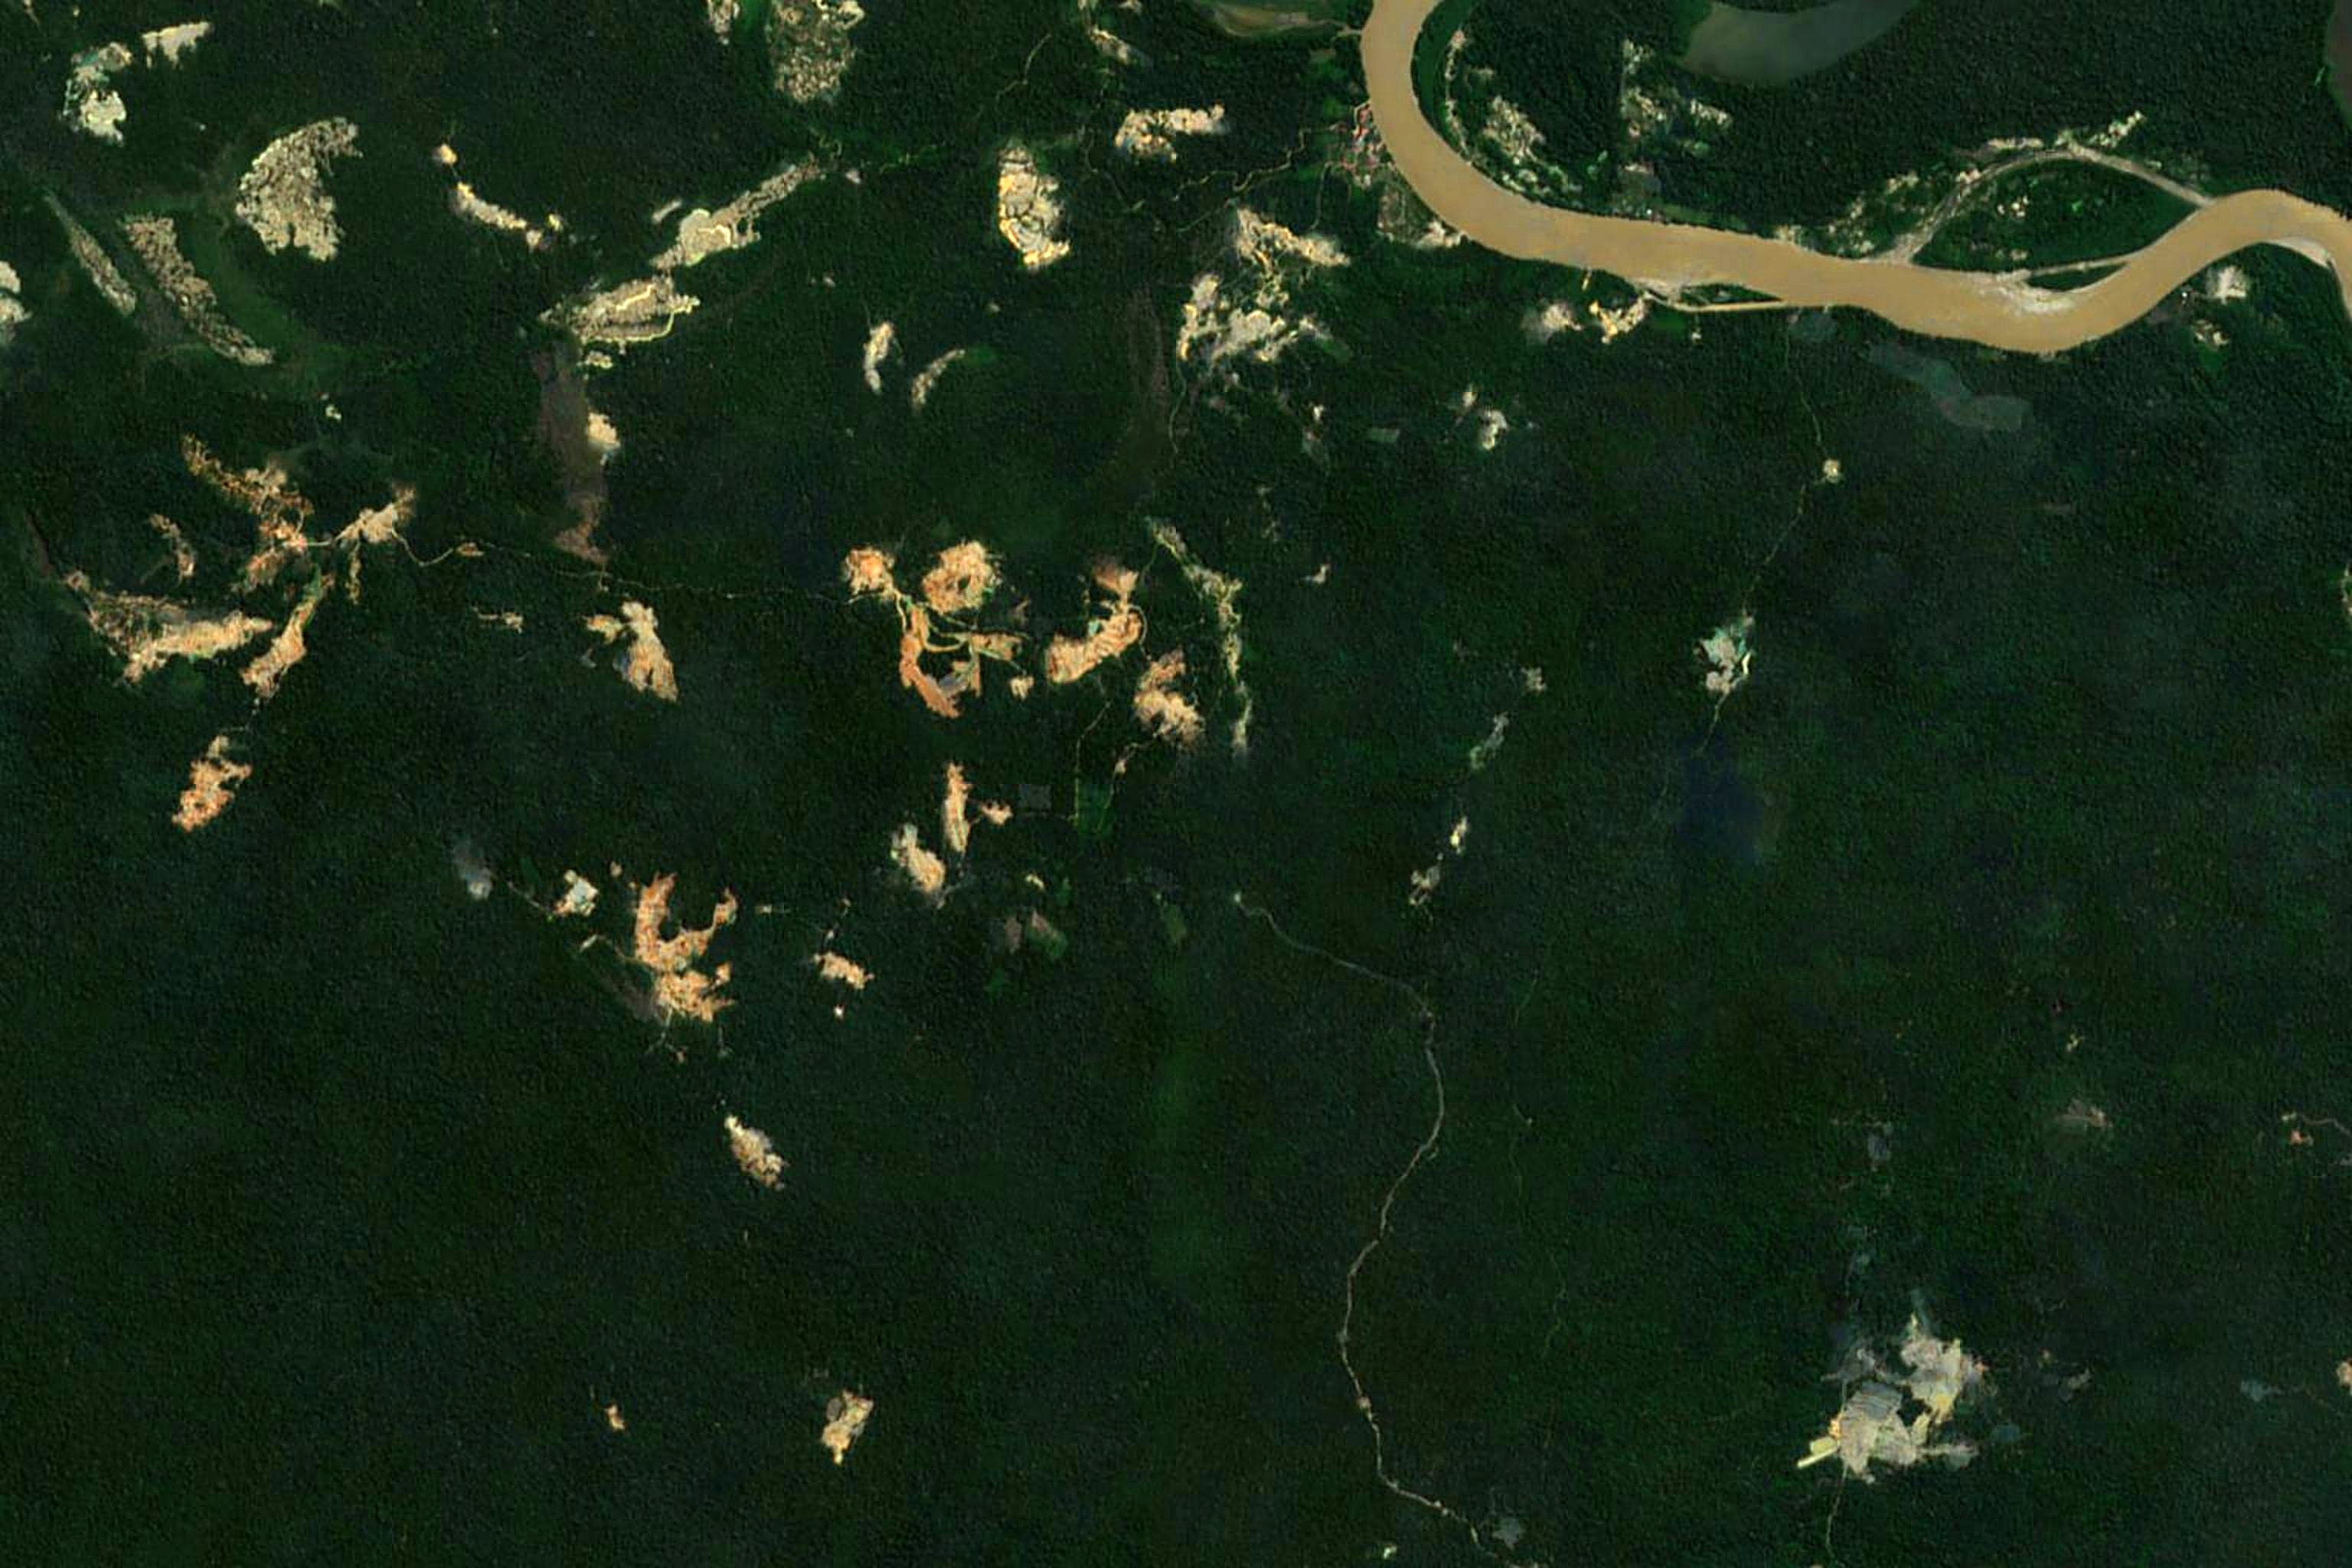
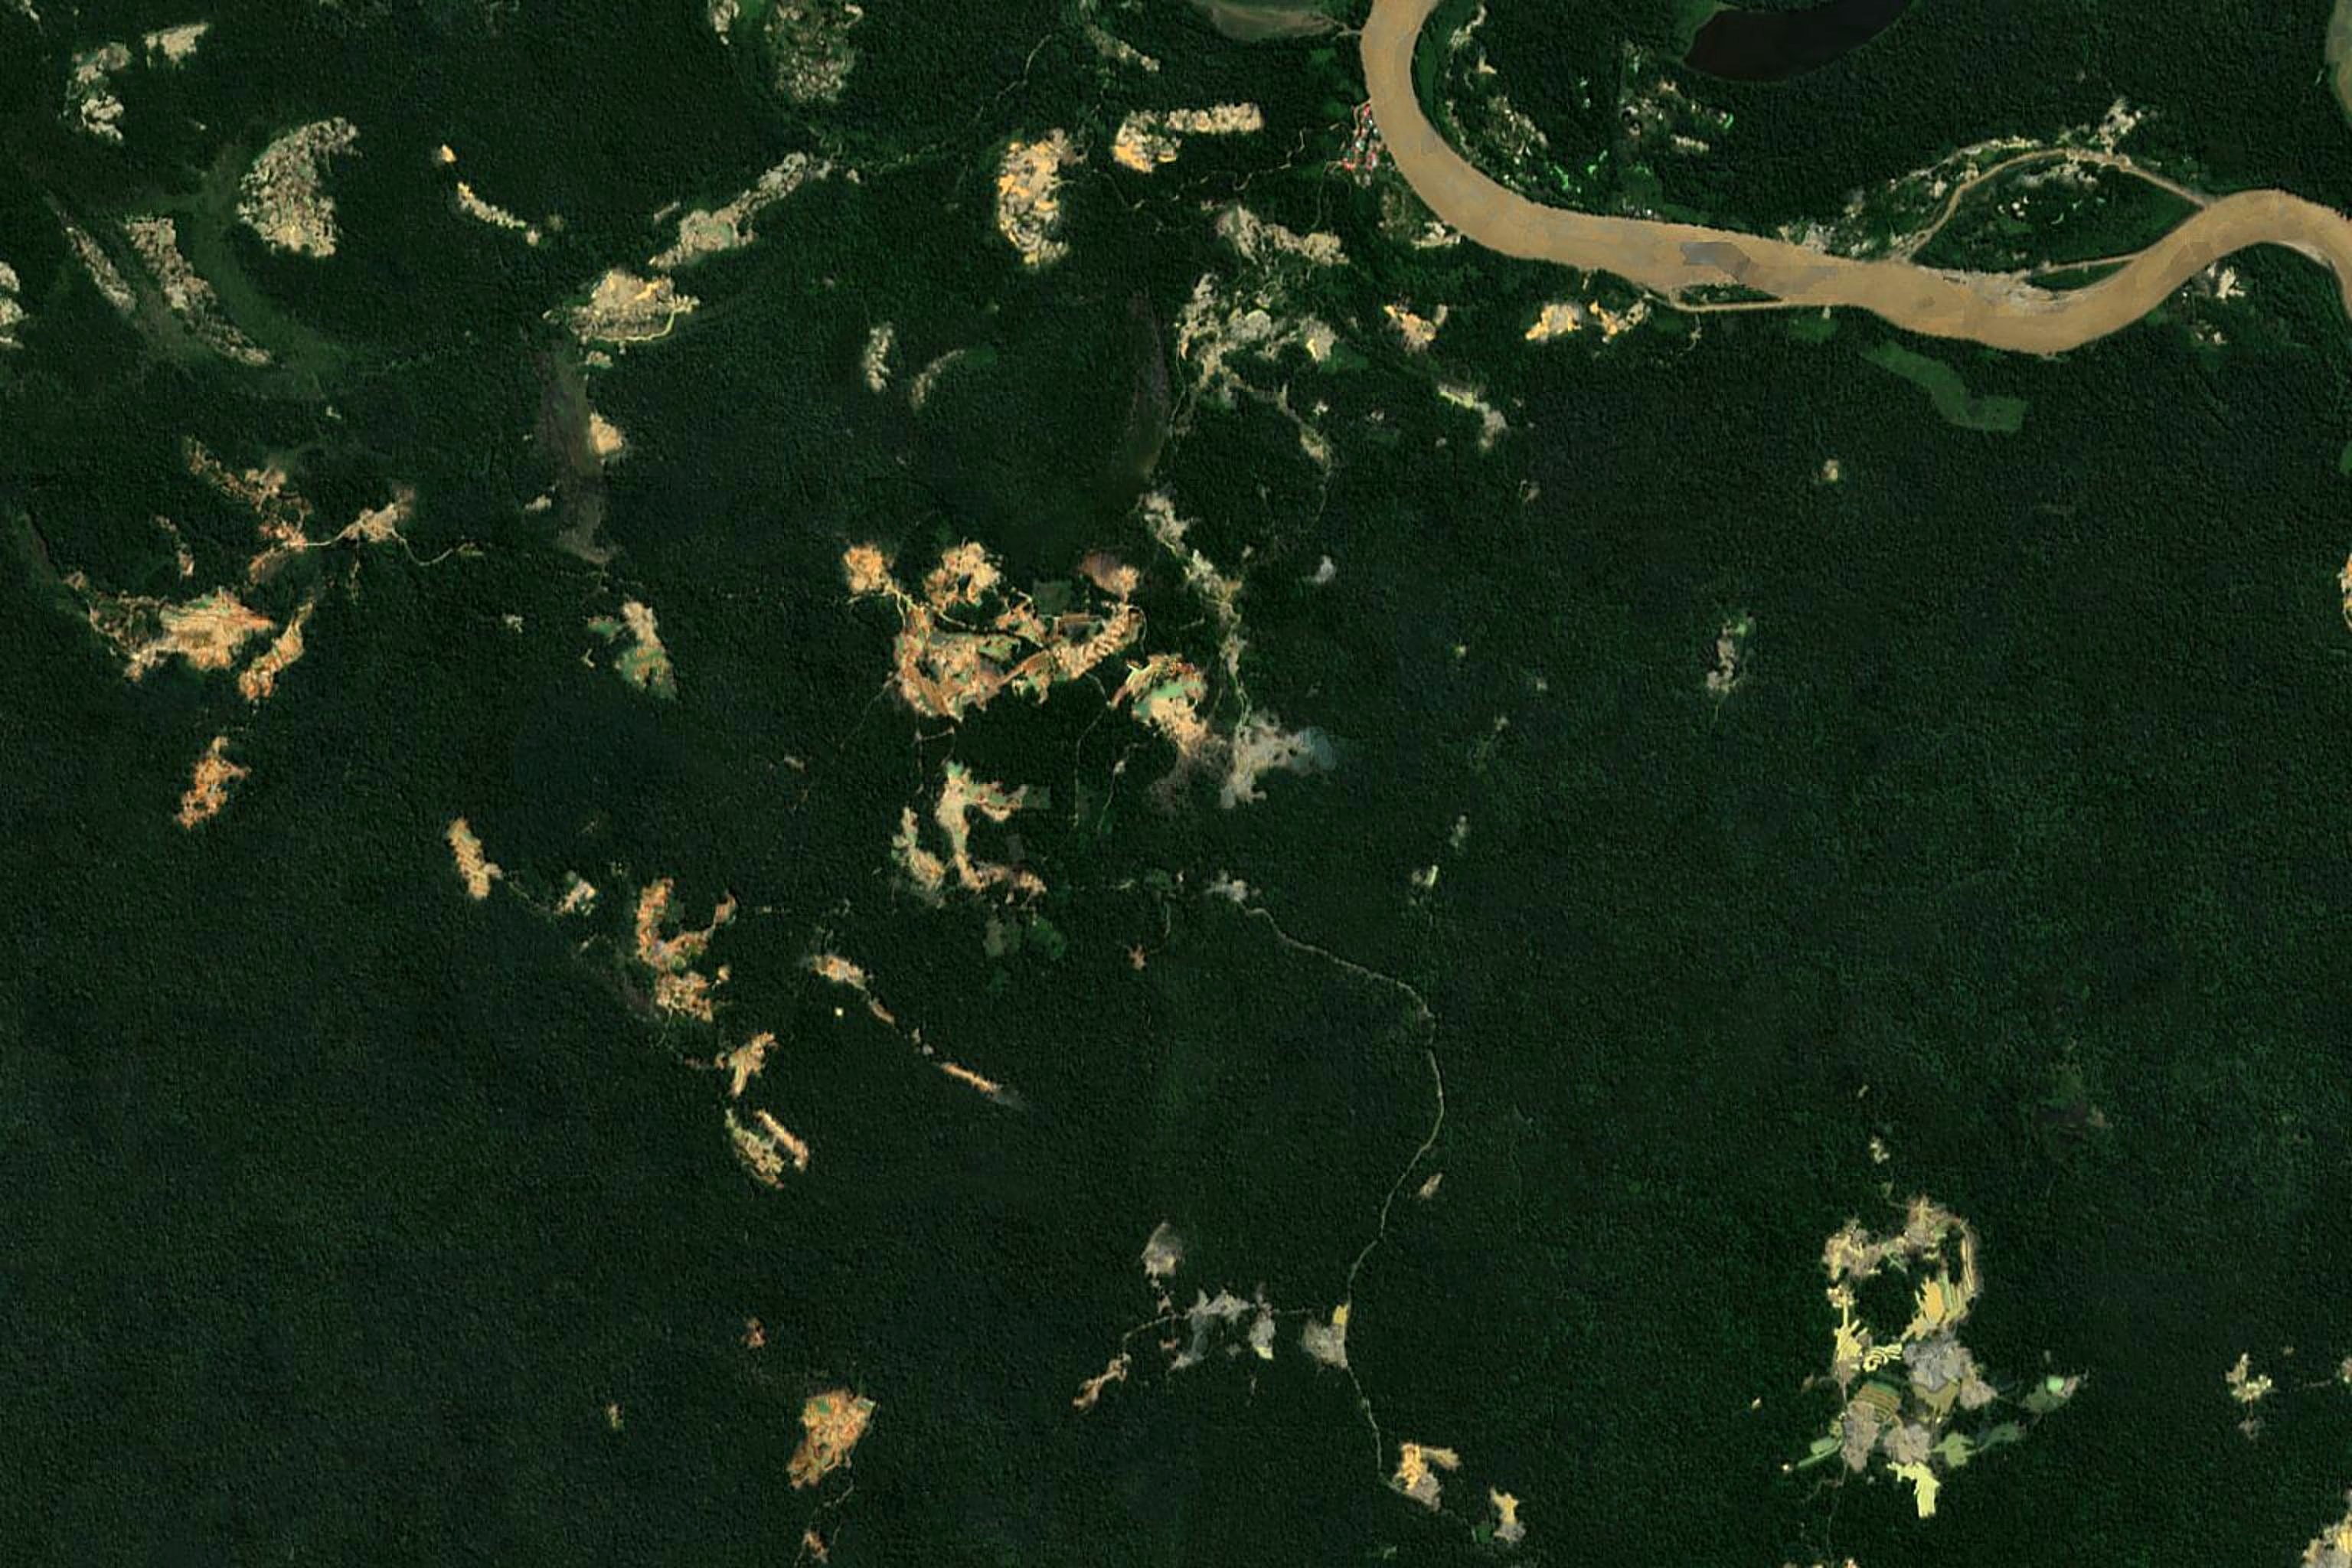
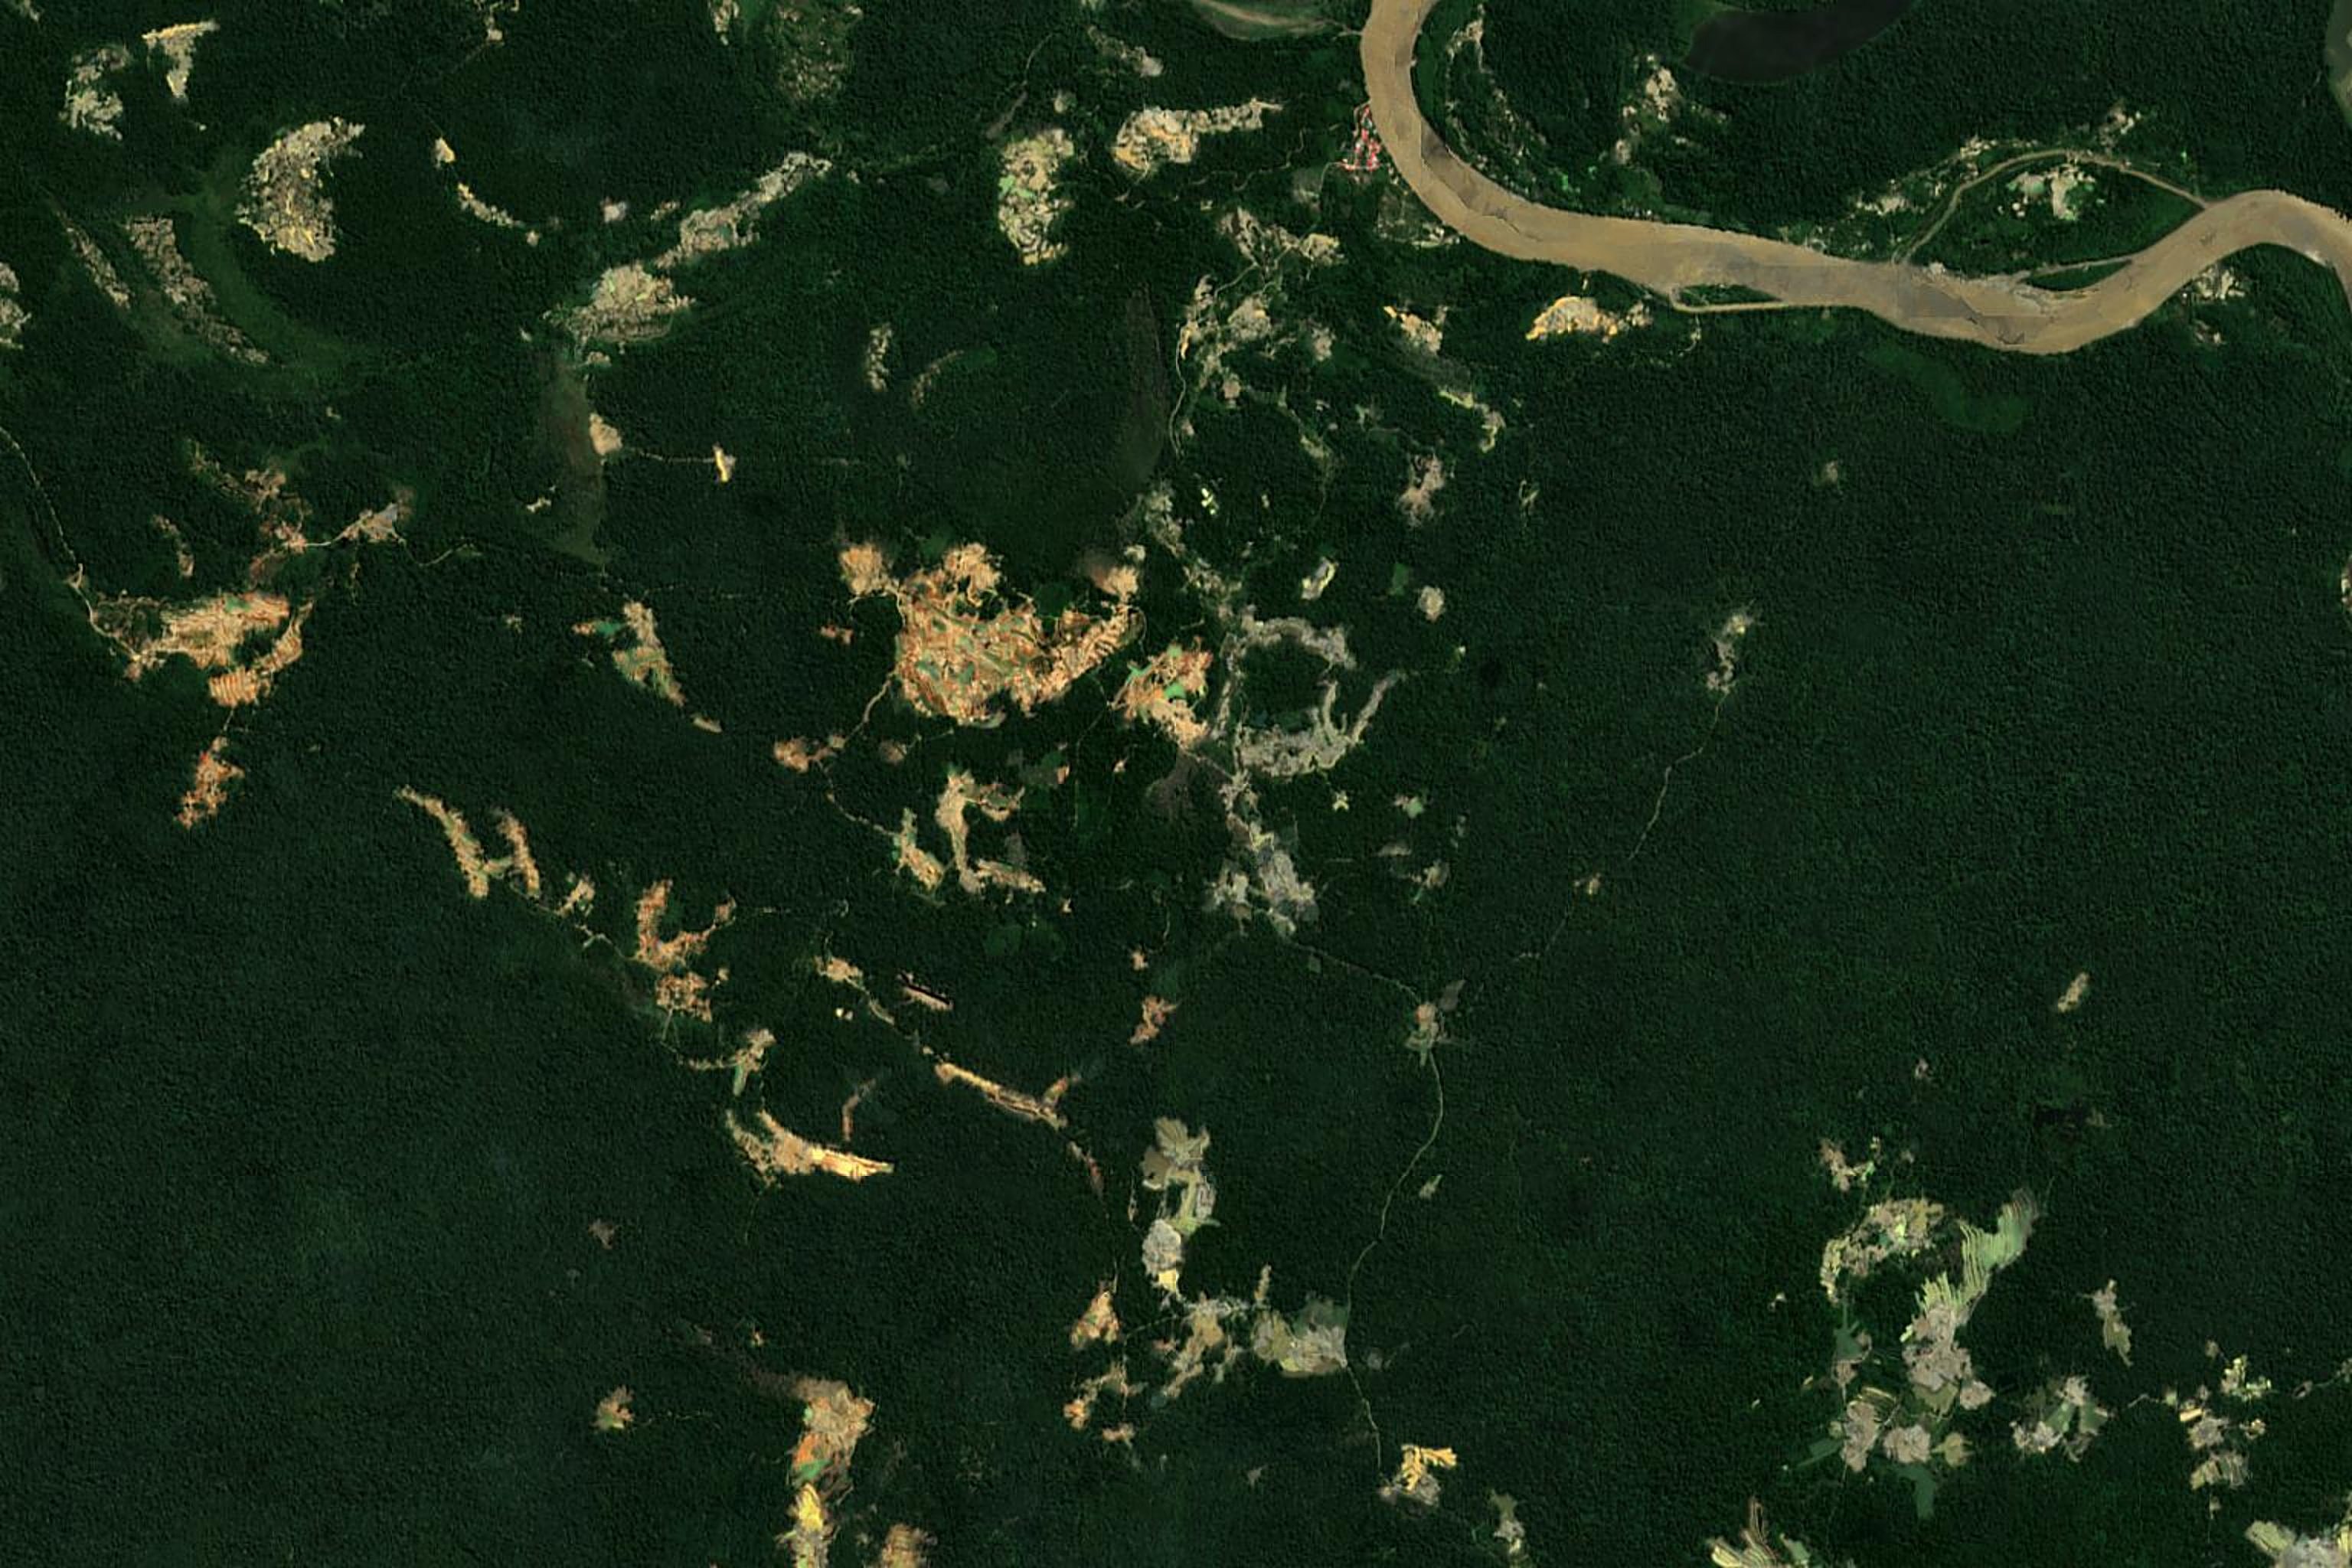
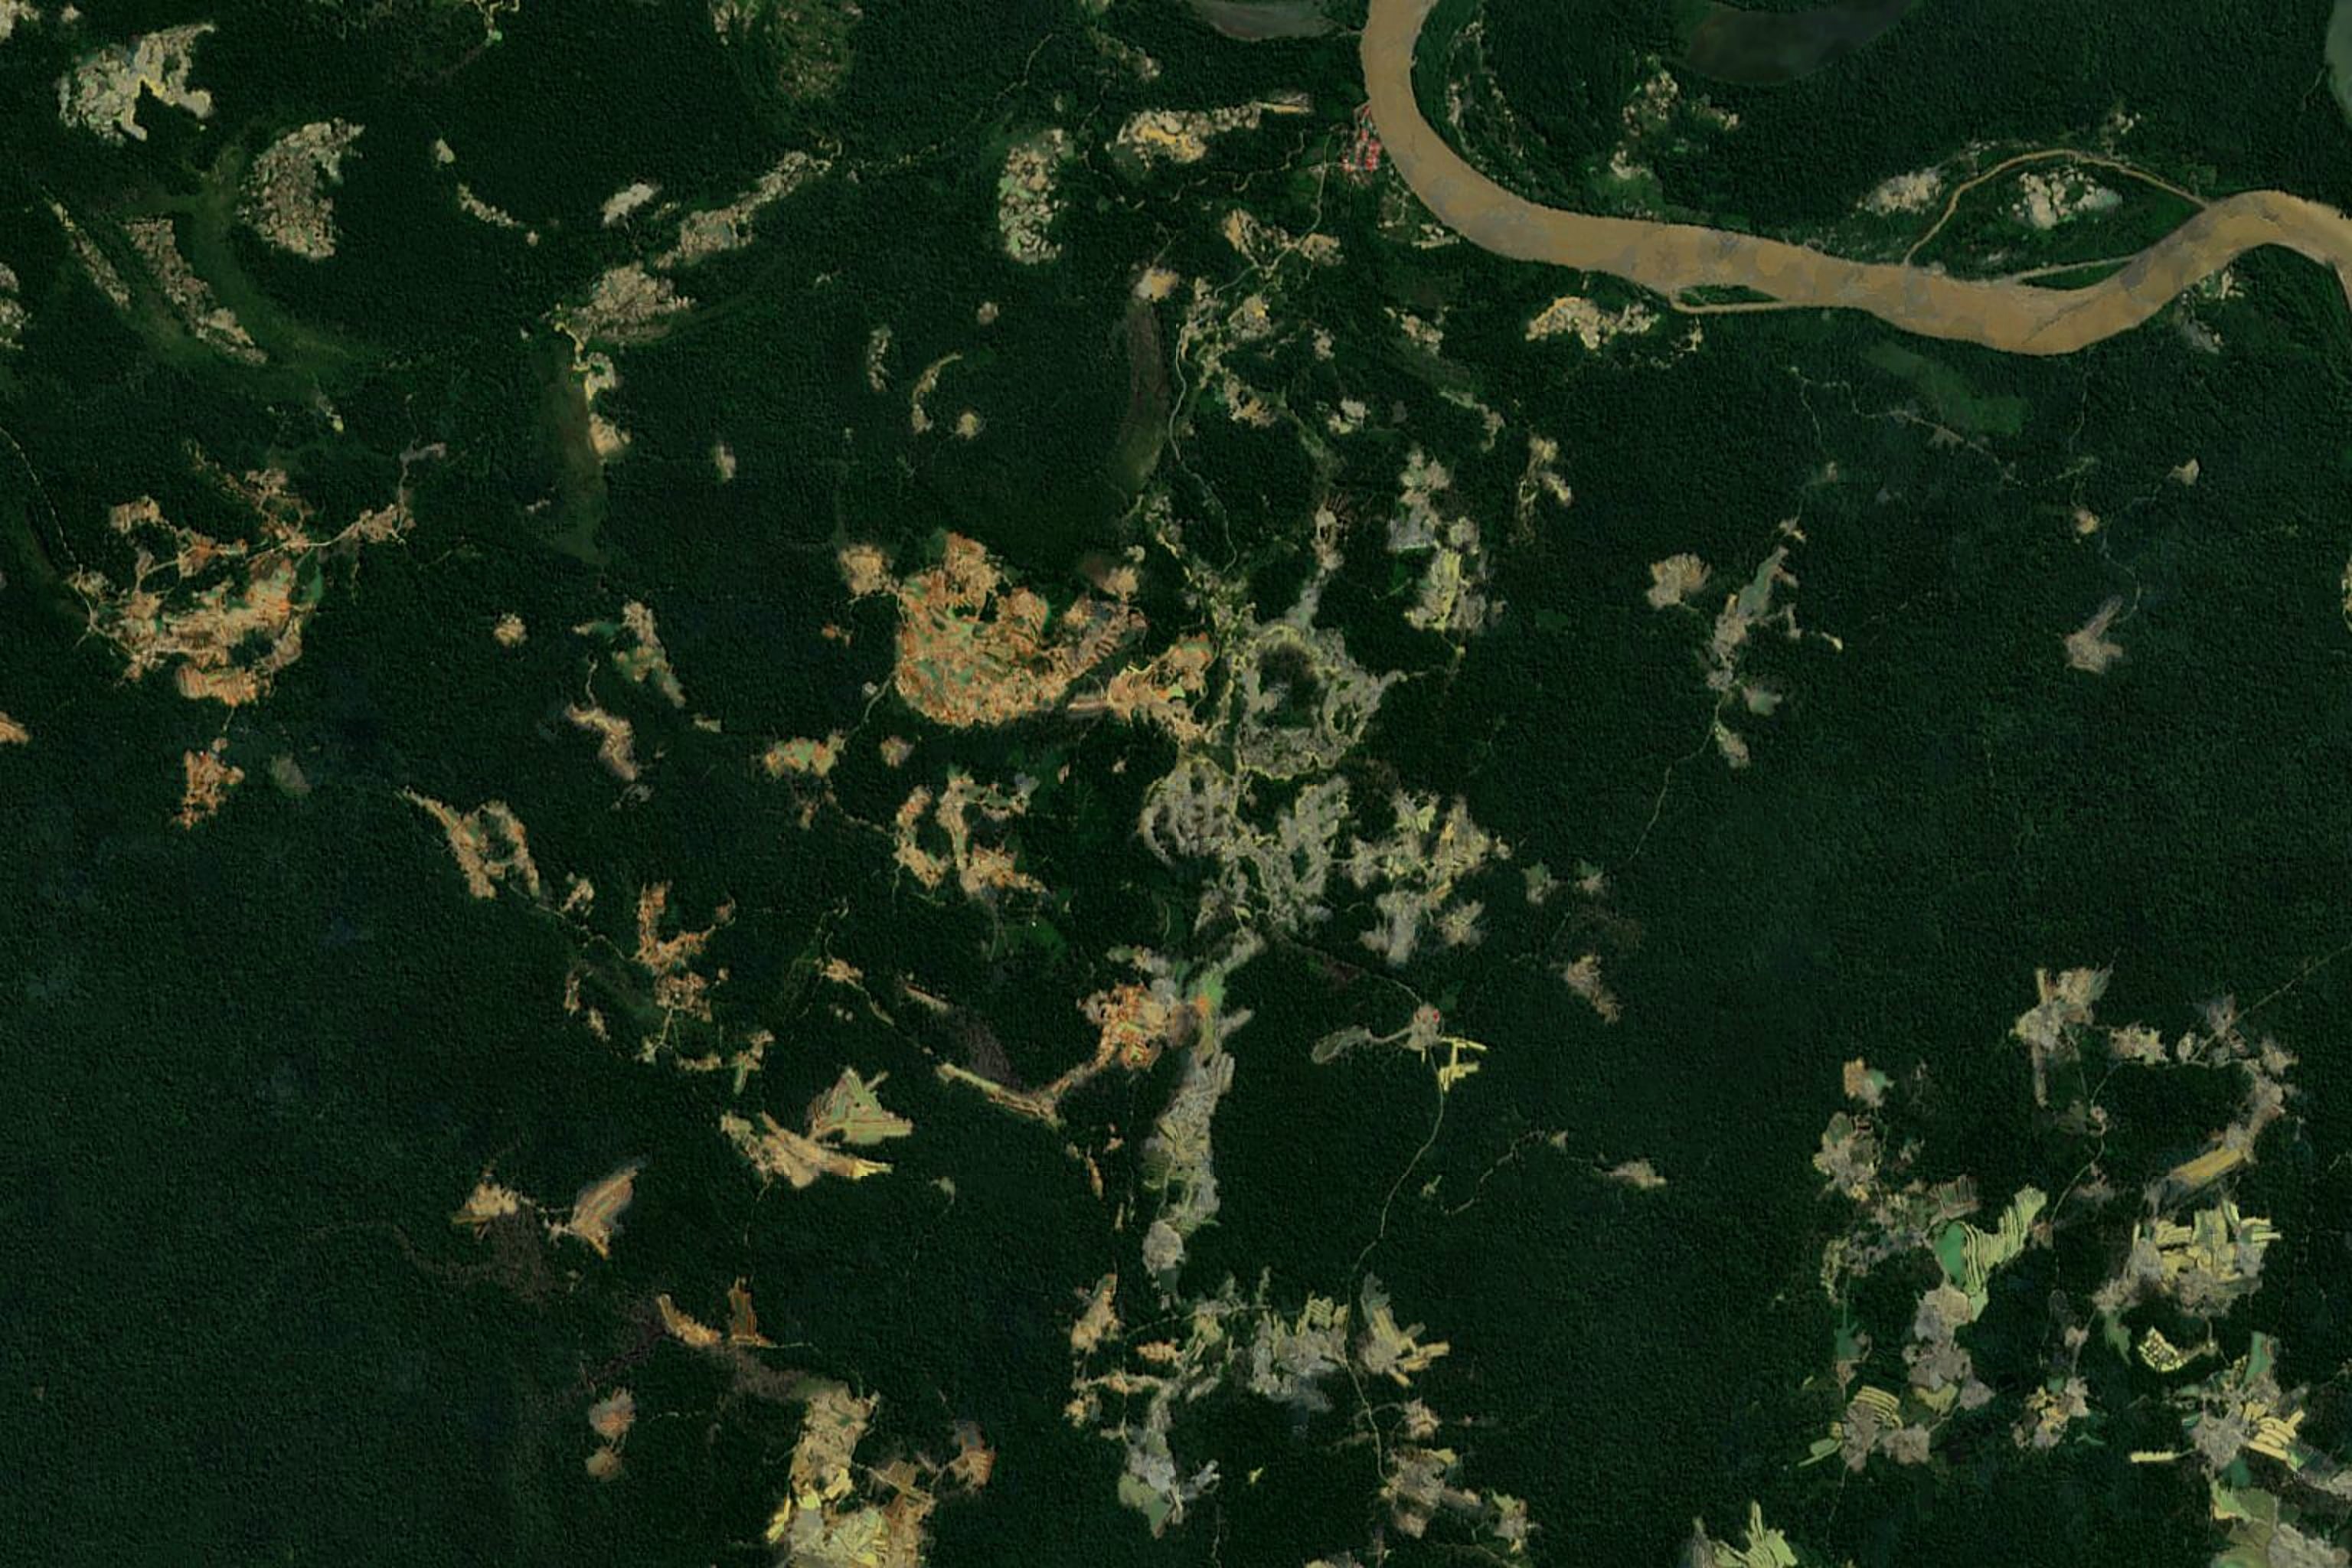
Background: one place near the Madre de Dios river, outside protected areas, seen by satellite each year from 2016 to 2025. Sentinel 2 cloudless by EOX IT Services (contains modified Copernicus Sentinel data).
Hello. We are group 5, the Giant River Turtle. Our question: what should FZS track every year about illegal gold mining. We start with our animal.
Before we start · our animal
Two facts about the giant river turtle
73 kg
The biggest river turtle in South America. The record female weighed 73 kg, about as much as an adult person.
11
Hatchlings call from inside the egg. The mothers answer and leave with them. Scientists recorded 11 types of sounds.
They lay their eggs on river sand beaches. Gold miners dig the same beaches and rivers.
Napo River · Charles J. Sharp · CC BY-SA 4.0
FAO species profile, Podocnemis expansa; Ferrara, Vogt and Sousa Lima (2013), Journal of Comparative Psychology. Photo: Wikimedia Commons
Fact one: it is the biggest river turtle in South America; a female can weigh as much as a person. Fact two: the hatchlings call to their mothers from inside the egg. This matters here because they nest on river sand beaches, where alluvial gold mining happens.
Why timing matters
The yearly satellite maps show new mining many months later
2021 to 2023
the surge: forest lost to mining more than doubles
March 2023
the first MapBiomas Peru map, with data up to 2021
5 to 17
months late, depending on the year
So we looked for numbers that move earlier and say where, to add to the maps and to field work.
Release dates: Panamericana (Collection 1), MapBiomas Peru (Collections 2 and 3), Caretas (Collection 4). Forest lost: MapBiomas Peru C4.
The yearly satellite maps are excellent, but they are slow. In the surge, 2021 to 2023, forest lost to mining more than doubled. The first MapBiomas map, with data up to 2021, came out in March 2023. Each yearly map came 5 to 17 months after the year ended. So we looked for numbers that move earlier and say where, to add to the maps and to what FZS sees in the field.
What the data showed first · Madre de Dios
The satellite maps confuse old mining ponds with water
Mining land called water in 2021 and 20224,595 ha
Then called mining again in 2023: 39% of all new mining land9,616 ha
The same jump in the rest of Peru in 2023, so the map itself likely changed× 2.7
Decision: we only count forest that became mining. Trees turning into bare ground are easy to see from space.
MapBiomas Peru Collection 4, transitions. Ponds are hard to classify: Caballero Espejo et al. 2018; Camalan et al. 2022.
Our first finding is about the data itself. Old mining pits fill with water, and the satellite model calls them water. Later it calls them mining again. In 2021 and 2022, almost 4,600 hectares of mining were called water. In 2023, more than 9,600 hectares of water were called mining again. The same jump happened in the rest of Peru, so the model likely changed. Studies on Madre de Dios also show that mining ponds are hard to classify. Trees turning into bare ground are much easier to see from space. So we only count forest that became mining.
How we chose the KPIs
Three speeds, five tests
Early · monthly
Before new mining appears
Gold price and gold trade. Pressure shows up months before the maps.
KPI 1 · gold price KPI 2 · gold gap
Now · quarterly
Where mining is happening
Satellite detections, available days after each quarter ends.
KPI 3 · FZS landscapes KPI 5 · outside Madre de Dios
Late · yearly
How much forest was lost
The yearly maps. 5 to 17 months late, but the reference for donors.
KPI 4 · forest lost
Five tests for every KPI
Free and publicArrives in timeSays whereHas a clear actionClear about what it cannot see
No single number passes every test. So we combine three speeds. The gold numbers move months before new mining appears on the maps. The quarterly satellite data show where mining is happening. The yearly maps confirm how much forest was lost, and they are the reference for donors. Each KPI also had to pass five tests: public, on time, says where, has a clear action, and is clear about what it cannot see.
How we set the thresholds
One simple red line for each KPI
Rule 1
Clearly above normal
Gold price 20% above its average of the last 3 years.
KPI 1 · gold price
Rule 2
Average plus 2 standard deviations
Far above its own past. Normal ups and downs stay below the line.
KPI 2 · gold gap KPI 4 · forest lost
Rule 3
More than the same quarters last year
More than 25% higher. In a reserve: one quarter worse than the worst whole year.
KPI 3 · FZS landscapes KPI 5 · outside Madre de Dios
Each KPI has one simple red line. Three kinds of rule. The gold price: 20 percent above its average of the last three years. The gold gap and the yearly forest loss: far above their own past, with the average plus two standard deviations. The quarterly satellite numbers: much more than the same quarters last year, or inside a reserve, one quarter worse than the worst whole year.
Our answer
Five KPIs for FZS
1
Gold price in solescompared with its average of the last 3 years
Early · monthly
Red1.23 in Sep 2026
2
Peru's gold gapgold exported minus gold declared as produced
Early · monthly
Not red51% of exports, stable
3
New mining in FZS landscapeshectares, Tambopata reserve, buffer zones, native communities
Now · quarterly
Red966 ha inside the reserve
4
Forest that became miningreserves and buffer zones; all of Madre de Dios
Late · yearly
Red175 ha in reserves, 2025
5
New mining outside Madre de Diosnew mining in the rest of Peru
Now · quarterly
Not red11% lower this year so far
Here is our answer. Two early numbers, two quarterly numbers, one yearly number. Today three of the five are red. Let me show each one quickly.
KPI 1 and KPI 2 · early
Gold pressure rose before the surge
Red today. Gold in soles is 23% above its 3 year normal. First red in February 2020, before the surge.
Half of Peru's exported gold is not declared as produced. The share jumped in April 2021. Today it is stable: not red.
Possible use: planning patrols and flights for the next dry season.
World Bank Pink Sheet; Central Bank of Peru (BCRP). Shaded: the 2021 to 2023 surge.
Left: the gold price in soles, compared with its normal. It turned red in February 2020, a year before the surge, and it is red again now. Right: Peru exports much more gold than it declares. About half has no declared origin. We watch the jumps. It jumped in April 2021. Today it is high but stable. These two show pressure building, not where it will land.
KPI 3 · now · Tambopata National Reserve
Mining is moving into the Tambopata reserve
194→966 ha+397%
New mining inside the reserve, first three quarters of 2025 and of 2026
Tambopata buffer zone+89%
Amarakaeri buffer zone+219%
Native communities+196%
Rest of Madre de Dios+12%
2025 and 2026 match MAAP and Global Conservation. 2026 Q3 is provisional.
Possible next step: share the locations with SERNANP and the environmental prosecutor.
This is our main finding. Inside the Tambopata reserve, new mining went from 194 to 966 hectares. The dashed line is the worst whole year before 2025: 56 hectares. Since the second quarter of 2025, all quarters are above it. Buffer zones and native communities are also red. Two independent sources agree with the size. A possible next step is to share the locations with SERNANP and the environmental prosecutor.
KPI 4 · late · MapBiomas yearly map
The yearly map confirms it inside FZS areas
Inside the reserves red line 52 ha175 ha
Buffer zones red line 2,595 ha2,992 ha
All Madre de Dios record year, but the line moved up after the surge10,308 ha
Takeaway: thresholds exceeded when separating by reserves and buffer zones.
MapBiomas Peru Collection 4, transitions. Reserves and buffer zones of Tambopata, Amarakaeri, Bahuaja Sonene and Manu.
The yearly map confirms the problem inside FZS areas. Inside the reserves and in the buffer zones, 2025 is above the red line. In the whole department 2025 is a record, but the red line moved up after the surge, so it is not red. So in donor reports it helps to say record year in words.
KPI 5 · now · Amazon Mining Watch
Mining is spreading outside Madre de Dios
992→3,304 ha
2019 and 2025 (provisional)
Mostly in Huánuco, near El Sira.
65% is inside mining concessions, so we say "spreading", not "illegal".
KPI 5 watches the rest of Peru. New mining outside Madre de Dios went from about one thousand hectares in 2019 to more than three thousand in 2025, mostly in Huánuco. Most of it is inside mining concessions, so we call it spreading, not illegal. Today it is not red.
Would it have warned in time?
Early signals came two years before the maps
KPI 1 · gold price redFeb 2020
KPI 2 · gold gap jumps (public two months later)Apr 2021
KPI 4 · first yearly map shows the surgeMar 2023
KPI 3 · Tambopata reserve red2025 Q2
An early signal shows pressure. It is not a forecast of hectares.
It can be a false alarm. The gold gap was also red in 2017 and 2018, with no surge after.
Same sources as KPI 1 to KPI 4: World Bank; BCRP; MapBiomas Peru; Amazon Mining Watch
Using only data that was public at the time: the gold price was red in February 2020. The gold gap in April 2021, public about two months later. The yearly maps showed the surge only in March 2023. And the reserve alarm fired in the second quarter of 2025. Early signals can also be false alarms, so they show pressure, not a forecast.
Context, not KPIs
Other traces of illegal gold
Brazil · health
12,989
malaria cases caught in garimpos, 2025
Strong signal, but for Brazil only
Colombia · rivers
117
dredges seized in the Amazon departments, 2025
Also measures police effort
Peru · mercury
176 t → 0
legal mercury imports, 2011 to today
Mercury is now smuggled, so trade data cannot see it
Madre de Dios · coca
42 → 1,492 ha
coca grown, 2019 to 2025
Same land as mining, but no tested link
Madre de Dios · tolls
+68%
traffic at the mining toll, 2022 to 2025; other tolls almost flat
Only 3 tolls, and one stopped counting for 16 months
Peru · machines
× 2.3
excavator imports, 2019 to 2024
Also used for roads and farms
Ministério da Saúde; MinDefensa; UN Comtrade; Devida and UNODC; OSITRAN (Likitha's analysis)
We also looked beyond satellites and beyond Peru. Illegal gold leaves a different trace in each country: health data in Brazil, dredges in Colombia, trade in Peru. These are useful context, but each one has a weakness, written under it, so they are not main KPIs.
Ideas we did not have time to test
What FZS could add next
A
Count turtle nests on river beaches
Nesting beaches lost near mining. Our animal could become an indicator.
B
Use radar satellites
They see through clouds, so the rainy months are covered. SERNANP already runs one (RAMI).
C
Use FZS's own field reports
Ranger patrols and dredge counts on Madre de Dios rivers.
D
Watch El Niño and drought
El Niño years bring drought. Low rivers expose more beaches and banks, which may make mining easier. Erion's first test is not conclusive yet.
Ideas we did not test, but that could help FZS. First, count turtle nests on river beaches near mining: our animal could become an indicator. Second, radar satellites for the cloudy months. Third, FZS's own field reports. And Erion's idea: El Niño years bring drought, low rivers open more beaches, so mining may be easier. His first test is not conclusive, so it needs more data.
The five KPIs, live
Thank you. Questions?
Scan to open the dashboard with the five KPIs. It updates when the notebook runs again.
Dashboard: Group 5, built from the tables in this repository
To finish: all five KPIs are in one dashboard. You can open it with this QR code. It reads our repository, so the numbers update when the notebook runs again. Thank you. We are happy to take your questions.